Appendix A - Urban Form Analysis: Canberra's Sustainability ...
Appendix A - Urban Form Analysis: Canberra's Sustainability ...
Appendix A - Urban Form Analysis: Canberra's Sustainability ...

Create successful ePaper yourself
Turn your PDF publications into a flip-book with our unique Google optimized e-Paper software.
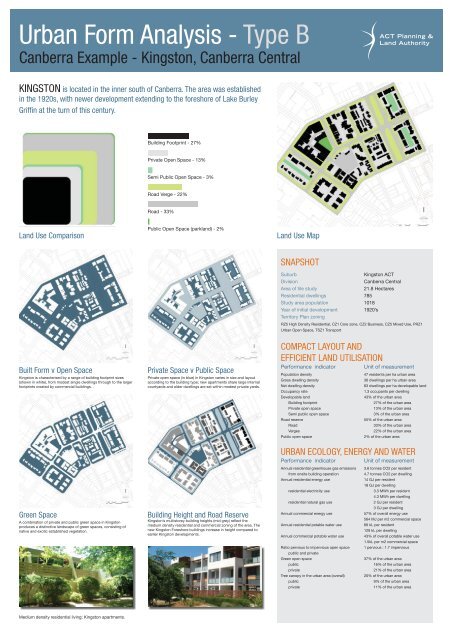
<strong>Urban</strong> <strong>Form</strong> <strong>Analysis</strong> - Type B<br />
Canberra Example - Kingston, Canberra Central<br />
KINGSTON is located in the inner south of Canberra. The area was established<br />
in the 1920s, with newer development extending to the foreshore of Lake Burley<br />
Griffin at the turn of this century.<br />
Land Use Comparison Land Use Map<br />
Built <strong>Form</strong> v Open Space<br />
Kingston is characterised by a range of building footprint sizes<br />
(shown in white), from modest single dwellings through to the larger<br />
footprints created by commercial buildings. .<br />
Green Space<br />
A combination of private and public green space in Kingston<br />
produces a distinctive landscape of green spaces, consisting of<br />
native and exotic established vegetation.<br />
Medium density residential living; Kingston apartments.<br />
Building Footprint - 27%<br />
Private Open Space - 13%<br />
Semi Public Open Space - 3%<br />
Road Verge - 22%<br />
Road - 33%<br />
Public Open Space (parkland) - 2%<br />
Private Space v Public Space<br />
Private open space (in blue) in Kingston varies in size and layout<br />
according to the building type; new apartments share large internal<br />
courtyards and older dwellings are set within modest private yards.<br />
Building Height and Road Reserve<br />
Kingston’s multistorey building heights (mid grey) refl ect the<br />
medium density residential and commercial zoning of the area. The<br />
new Kingston Foreshore buildings increase in height compared to<br />
earlier Kingston developments.<br />
SNAPSHOT<br />
Suburb Kingston ACT<br />
Division Canberra Central<br />
Area of tile study 21.8 Hectares<br />
Residential dwellings 785<br />
Study area population 1018<br />
Year of initial development 1920’s<br />
Territory Plan zoning<br />
RZ5 High Density Residential, CZ1 Core zone, CZ2 Business, CZ5 Mixed Use, PRZ1<br />
<strong>Urban</strong> Open Space, TSZ1 Transport<br />
COMPACT LAYOUT AND<br />
EFFICIENT LAND UTILISATION<br />
Performance indicator Unit of measurement<br />
Population density 47 residents per ha urban area<br />
Gross dwelling density 36 dwellings per ha urban area<br />
Net dwelling density 83 dwellings per ha developable land<br />
Occupancy rate 1.3 occupants per dwelling<br />
Developable land 43% of the urban area<br />
Building footprint 27% of the urban area<br />
Private open space 13% of the urban area<br />
Semi public open space 3% of the urban area<br />
Road reserve 55% of the urban area<br />
Road 33% of the urban area<br />
Verges 22% of the urban area<br />
Public open space 2% of the urban area<br />
URBAN ECOLOGY, ENERGY AND WATER<br />
Performance indicator Unit of measurement<br />
Annual residential greenhouse gas emissions 3.6 tonnes CO2 per resident<br />
from onsite building operation 4.7 tonnes CO2 per dwelling<br />
Annual residential energy use 14 GJ per resident<br />
18 GJ per dwelling<br />
residential electricity use 3.3 MWh per resident<br />
4.3 MWh per dwelling<br />
residential natural gas use 2 GJ per resident<br />
3 GJ per dwelling<br />
Annual commercial energy use 57% of overall energy use<br />
564 MJ per m2 commercial space<br />
Annual residential potable water use 66 kL per resident<br />
129 kL per dwelling<br />
Annual commercial potable water use 43% of overall potable water use<br />
1.5kL per m2 commercial space<br />
Ratio pervious to impervious open space<br />
public and private<br />
1 pervious : 1.7 impervious<br />
Green open space 37% of the urban area<br />
public 16% of the urban area<br />
private 21% of the urban area<br />
Tree canopy in the urban area (overall) 20% of the urban area<br />
public 9% of the urban area<br />
private 11% of the urban area

![HSR Training Programs Guidelines [ PDF 191KB]](https://img.yumpu.com/51348280/1/190x245/hsr-training-programs-guidelines-pdf-191kb.jpg?quality=85)


![Teachers Technical and Further Education [ PDF 68KB]](https://img.yumpu.com/34230751/1/184x260/teachers-technical-and-further-education-pdf-68kb.jpg?quality=85)