

Dynamic Risk Asset Allocation: Annual Report - Putnam Investments
Dynamic Risk Asset Allocation: Annual Report - Putnam Investments
Dynamic Risk Asset Allocation: Annual Report - Putnam Investments

Create successful ePaper yourself
Turn your PDF publications into a flip-book with our unique Google optimized e-Paper software.
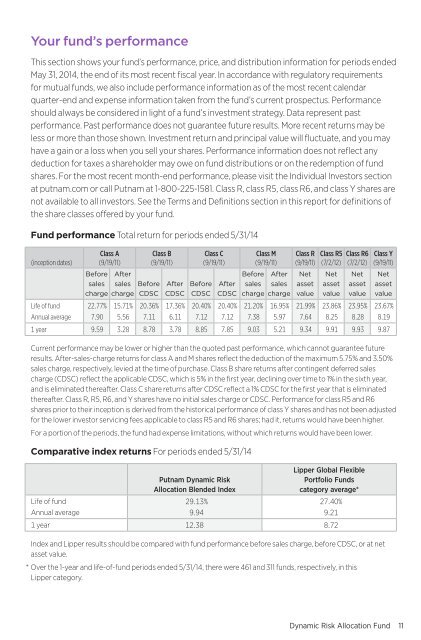
Your fund’s performanceThis section shows your fund’s performance, price, and distribution information for periods endedMay 31, 2014, the end of its most recent fiscal year. In accordance with regulatory requirementsfor mutual funds, we also include performance information as of the most recent calendarquarter-end and expense information taken from the fund’s current prospectus. Performanceshould always be considered in light of a fund’s investment strategy. Data represent pastperformance. Past performance does not guarantee future results. More recent returns may beless or more than those shown. Investment return and principal value will fluctuate, and you mayhave a gain or a loss when you sell your shares. Performance information does not reflect anydeduction for taxes a shareholder may owe on fund distributions or on the redemption of fundshares. For the most recent month-end performance, please visit the Individual Investors sectionat putnam.com or call <strong>Putnam</strong> at 1-800-225-1581. Class R, class R5, class R6, and class Y shares arenot available to all investors. See the Terms and Definitions section in this report for definitions ofthe share classes offered by your fund.Fund performance Total return for periods ended 5/31/14Class A Class B Class C Class M Class R Class R5 Class R6 Class Y(inception dates) (9/19/11 ) (9/19/11 ) (9/19/11 ) (9/19/11 ) (9/19/11 ) (7/2/12 ) (7/2/12 ) (9/19/11 )BeforesaleschargeAftersales Beforecharge CDSCAfterCDSCBeforeCDSCAfterCDSCBeforesaleschargeAftersaleschargeNetassetvalueNetassetvalueNetassetvalueNetassetvalueLife of fund 22.77 % 15.71 % 20.36 % 17.36 % 20.40 % 20.40 % 21.20 % 16.95 % 21.99 % 23.86 % 23.95 % 23.67 %<strong>Annual</strong> average 7.90 5.56 7.11 6.11 7.12 7.12 7.38 5.97 7.64 8.25 8.28 8.191 year 9.59 3.28 8.78 3.78 8.85 7.85 9.03 5.21 9.34 9.91 9.93 9.87Current performance may be lower or higher than the quoted past performance, which cannot guarantee futureresults. After-sales-charge returns for class A and M shares reflect the deduction of the maximum 5.75% and 3.50%sales charge, respectively, levied at the time of purchase. Class B share returns after contingent deferred salescharge (CDSC) reflect the applicable CDSC, which is 5% in the first year, declining over time to 1% in the sixth year,and is eliminated thereafter. Class C share returns after CDSC reflect a 1% CDSC for the first year that is eliminatedthereafter. Class R, R5, R6, and Y shares have no initial sales charge or CDSC. Performance for class R5 and R6shares prior to their inception is derived from the historical performance of class Y shares and has not been adjustedfor the lower investor servicing fees applicable to class R5 and R6 shares; had it, returns would have been higher.For a portion of the periods, the fund had expense limitations, without which returns would have been lower.Comparative index returns For periods ended 5/31/14<strong>Putnam</strong> <strong>Dynamic</strong> <strong>Risk</strong><strong>Allocation</strong> Blended IndexLipper Global FlexiblePortfolio Fundscategory average *Life of fund 29.13 % 27.40 %<strong>Annual</strong> average 9.94 9.211 year 12.38 8.72Index and Lipper results should be compared with fund performance before sales charge, before CDSC, or at netasset value.* Over the 1-year and life-of-fund periods ended 5/31/14, there were 461 and 311 funds, respectively, in thisLipper category.<strong>Dynamic</strong> <strong>Risk</strong> <strong>Allocation</strong> Fund 11


