

Dynamic Risk Asset Allocation: Annual Report - Putnam Investments
Dynamic Risk Asset Allocation: Annual Report - Putnam Investments
Dynamic Risk Asset Allocation: Annual Report - Putnam Investments

Create successful ePaper yourself
Turn your PDF publications into a flip-book with our unique Google optimized e-Paper software.
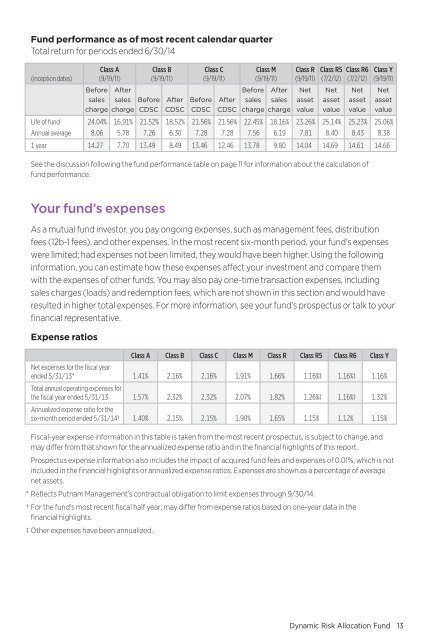
Fund performance as of most recent calendar quarterTotal return for periods ended 6/30/14Class A Class B Class C Class M Class R Class R5 Class R6 Class Y(inception dates) (9/19/11 ) (9/19/11 ) (9/19/11 ) (9/19/11 ) (9/19/11 ) (7/2/12 ) (7/2/12 ) (9/19/11 )BeforesaleschargeAftersales Beforecharge CDSCAfterCDSCBeforeCDSCAfterCDSCBeforesaleschargeAftersaleschargeNetassetvalueNetassetvalueNetassetvalueNetassetvalueLife of fund 24.04% 16.91% 21.52% 18.52% 21.56% 21.56% 22.45% 18.16% 23.26% 25.14% 25.23% 25.06%<strong>Annual</strong> average 8.06 5.78 7.26 6.30 7.28 7.28 7.56 6.19 7.81 8.40 8.43 8.381 year 14.27 7.70 13.49 8.49 13.46 12.46 13.78 9.80 14.04 14.69 14.61 14.66See the discussion following the fund performance table on page 11 for information about the calculation offund performance.Your fund’s expensesAs a mutual fund investor, you pay ongoing expenses, such as management fees, distributionfees (12b-1 fees), and other expenses. In the most recent six-month period, your fund’s expenseswere limited; had expenses not been limited, they would have been higher. Using the followinginformation, you can estimate how these expenses affect your investment and compare themwith the expenses of other funds. You may also pay one-time transaction expenses, includingsales charges (loads) and redemption fees, which are not shown in this section and would haveresulted in higher total expenses. For more information, see your fund’s prospectus or talk to yourfinancial representative.Expense ratiosClass A Class B Class C Class M Class R Class R5 Class R6 Class YNet expenses for the fiscal yearended 5/31/13* 1.41% 2.16% 2.16% 1.91% 1.66% 1.16%‡ 1.16%‡ 1.16%Total annual operating expenses forthe fiscal year ended 5/31/13 1.57% 2.32% 2.32% 2.07% 1.82% 1.26%‡ 1.16%‡ 1.32%<strong>Annual</strong>ized expense ratio for thesix-month period ended 5/31/14† 1.40% 2.15% 2.15% 1.90% 1.65% 1.15% 1.12% 1.15%Fiscal-year expense information in this table is taken from the most recent prospectus, is subject to change, andmay differ from that shown for the annualized expense ratio and in the financial highlights of this report.Prospectus expense information also includes the impact of acquired fund fees and expenses of 0.01%, which is notincluded in the financial highlights or annualized expense ratios. Expenses are shown as a percentage of averagenet assets.* Reflects <strong>Putnam</strong> Management’s contractual obligation to limit expenses through 9/30/14.† For the fund’s most recent fiscal half year; may differ from expense ratios based on one-year data in thefinancial highlights.‡ Other expenses have been annualized.<strong>Dynamic</strong> <strong>Risk</strong> <strong>Allocation</strong> Fund 13


