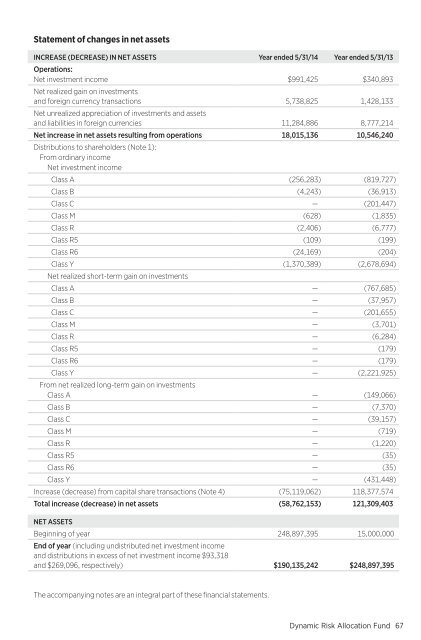
Statement of changes in net assetsINCREASE (DECREASE) IN NET ASSETS Year ended 5/31/14 Year ended 5/31/13Operations:Net investment income $991,425 $340,893Net realized gain on investmentsand foreign currency transactions 5,738,825 1,428,133Net unrealized appreciation of investments and assetsand liabilities in foreign currencies 11,284,886 8,777,214Net increase in net assets resulting from operations 18,015,136 10,546,240Distributions to shareholders (Note 1):From ordinary incomeNet investment incomeClass A (256,283) (819,727)Class B (4,243) (36,913)Class C — (201,447)Class M (628) (1,835)Class R (2,406) (6,777)Class R5 (109) (199)Class R6 (24,169) (204)Class Y (1,370,389) (2,678,694)Net realized short-term gain on investmentsClass A — (767,685)Class B — (37,957)Class C — (201,655)Class M — (3,701)Class R — (6,284)Class R5 — (179)Class R6 — (179)Class Y — (2,221,925)From net realized long-term gain on investmentsClass A — (149,066)Class B — (7,370)Class C — (39,157)Class M — (719)Class R — (1,220)Class R5 — (35)Class R6 — (35)Class Y — (431,448)Increase (decrease) from capital share transactions (Note 4) (75,119,062) 118,377,574Total increase (decrease) in net assets (58,762,153) 121,309,403NET ASSETSBeginning of year 248,897,395 15,000,000End of year (including undistributed net investment incomeand distributions in excess of net investment income $93,318and $269,096, respectively) $190,135,242 $248,897,395The accompanying notes are an integral part of these financial statements.<strong>Dynamic</strong> <strong>Risk</strong> <strong>Allocation</strong> Fund67
Financial highlights (For a common share outstanding throughout the period)INVESTMENT OPERATIONS: LESS DISTRIBUTIONS: RATIOS AND SUPPLEMENTAL DATA:Period endedÂClass AÂNet assetvalue,beginningof periodÂNet realizedand unrealizedNet investment gain (loss)income (lossÂ) a on investmentsÂTotal frominvestmentoperationsÂFromnet investmentincomeÂFromnet realized gainon investmentsÂTotaldisÂtriÂbutionsÂNet assetvalue, endof periodÂNet assets, Total returnvalue (%Â) b (in thousandsÂ)at net asset end of period(%Â) c,d (%Â) d (%Â)Ratioof expensesto averagenet assetsRatio of netinvestmentincome (loss)to averagenet assetsPortfolioturnoverMay 31, 2014 $10.63 .04 .98 1.02 (.07Â) — (.07Â) $11.58 9.59 $33,884 1.40 .33 117 eMay 31, 2013 10.24 .01 .81 .82 (.20Â) (.23Â) (.43Â) 10.63 7.97 68,440 1.40 .06 40 eMay 31, 2012† 10.00 (.02Â) .39 .37 (.09Â) (.04Â) (.13Â) 10.24 3.77Â* 38,666 .98Â* (.22Â) * 41Â*Class BÂMay 31, 2014 $10.53 (.03Â) .95 .92 (.01Â) — (.01Â) $11.44 8.78 $3,705 2.15 (.32Â) 117 eMay 31, 2013 10.20 (.07Â) .81 .74 (.18Â) (.23Â) (.41Â) 10.53 7.22 2,852 2.15 (.61Â) 40 eMay 31, 2012† 10.00 (.07Â) .38 .31 (.07Â) (.04Â) (.11Â) 10.20 3.19Â* 727 1.50Â* (.68Â) * 41Â*Class CÂMay 31, 2014 $10.51 (.04Â) .97 .93 — — — $11.44 8.85 $16,325 2.15 (.38Â) 117 eMay 31, 2013 10.19 (.06Â) .80 .74 (.19Â) (.23Â) (.42Â) 10.51 7.18 21,015 2.15 (.57Â) 40 eMay 31, 2012† 10.00 (.07Â) .38 .31 (.08Â) (.04Â) (.12Â) 10.19 3.21Â* 3,151 1.50Â* (.66Â) * 41Â*Class MÂMay 31, 2014 $10.66 (.01Â) .97 .96 (.02Â) — (.02Â) $11.60 9.03 $339 1.90 (.09Â) 117 eMay 31, 2013 10.21 (.05Â) .82 .77 (.09Â) (.23Â) (.32Â) 10.66 7.52 358 1.90 (.47Â) 40 eMay 31, 2012† 10.00 (.06Â) .39 .33 (.08Â) (.04Â) (.12Â) 10.21 3.39Â* 363 1.33Â* (.60Â) * 41Â*Class RÂMay 31, 2014 $10.59 .02 .97 .99 (.06Â) — (.06Â) $11.52 9.34 $484 1.65 .17 117 eMay 31, 2013 10.23 (.01Â) .80 .79 (.20Â) (.23Â) (.43Â) 10.59 7.70 458 1.65 (.11Â) 40 eMay 31, 2012† 10.00 (.05Â) .40 .35 (.08Â) (.04Â) (.12Â) 10.23 3.59Â* 102 1.15Â* (.45Â) * 41Â*Class R5ÂMay 31, 2014 $10.68 .07 .98 1.05 (.11Â) — (.11Â) $11.62 9.91 $12 1.15 .67 117 eMay 31, 2013†† 10.56 .03 .53 .56 (.21Â) (.23Â) (.44Â) 10.68 5.26Â* 11 1.05Â* .25Â* 40 eClass R6ÂMay 31, 2014 $10.68 .07 .98 1.05 (.12Â) — (.12Â) $11.61 9.93 $2,055 1.11 .68 117 eMay 31, 2013†† 10.56 .08 .49 .57 (.22Â) (.23Â) (.45Â) 10.68 5.31Â* 2,713 1.05Â* .63Â* 40 eClass YÂMay 31, 2014 $10.65 .07 .98 1.05 (.11Â) — (.11Â) $11.59 9.87 $133,332 1.15 .64 117 eMay 31, 2013 10.26 .03 .82 .85 (.23Â) (.23Â) (.46Â) 10.65 8.21 153,051 1.15 .32 40 eMay 31, 2012† 10.00 .01 .38 .39 (.09Â) (.04Â) (.13Â) 10.26 4.02Â* 84,578 .80Â* .11Â* 41Â*See notes to financial highlights at the end of this section.The accompanying notes are an integral part of these financial statements.68 <strong>Dynamic</strong> <strong>Risk</strong> <strong>Allocation</strong> Fund <strong>Dynamic</strong> <strong>Risk</strong> <strong>Allocation</strong> Fund69