AP Physics--Graphing
AP Physics--Graphing
AP Physics--Graphing

You also want an ePaper? Increase the reach of your titles
YUMPU automatically turns print PDFs into web optimized ePapers that Google loves.
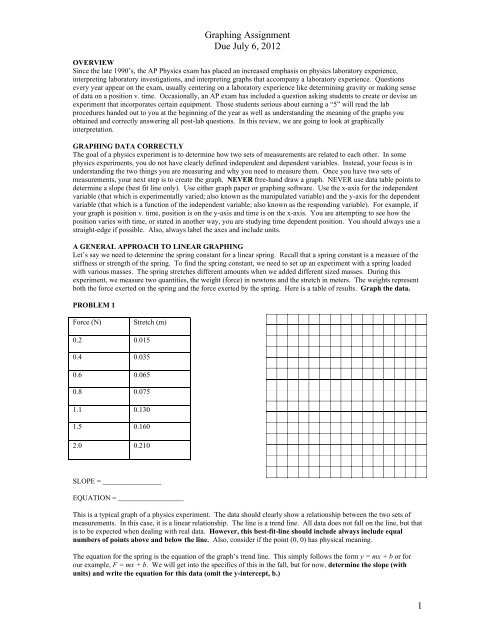
<strong>Graphing</strong> AssignmentDue July 6, 2012WHAT IF THE GR<strong>AP</strong>H IS CURVED?Here is where the fun begins. If we get a nonlinear relationship between our physical quantities, we will need toinvestigate further to figure out the exact model for this relationship. This is where your graphing calculator comes invery handy. However, while you may be able to obtain a graph on the calculator, you will need to be able to properlytransfer it to the graph paper on the <strong>AP</strong> exam.LINEARIZING DATAThe process described in the previous example is called linearizing data. It is a simple five-step process:1) Graph the original data.2) Look at the shape of the type of relationship it represents (quadratic, cubic, square root, and inverse are themost common).3) Create a second set of data for the type of relationship you determined your graph represents. These data willhave different x values. In the previous example, x changed from time to time squared. If the graphed shapewould have been a square root curve, the altered x would have been the square root of x.4) Create a graph of the new data.5) Use the slope-intercept form of the line to create the exact relationship for your data. You can see why thisprocess is called linearizing the data.This is the most important data analysis skill you can learn in an <strong>AP</strong> <strong>Physics</strong> course. You will be practicing it byworking with graphs that present you with interesting relationships we have seen throughout the course. The followingare the most common relationships:1) y = kx2) y = kx 23) y = k/x4) y = k/x 25) y = k√xPROBLEM 2Here is a sample set of position v. time data. Graph position as a function of time. Then create a second graph tolinearize the data by manipulating time (t 2 , 1/t, 1/t 2 , t ½ ). For the linear graph, determine the slope (with units)and the equation for the linear plot.Position (m)Time (t)5 0.010 1.016 1.526 2.036 2.551 3.0SLOPE = _________ EQUATION = _______________2
<strong>Graphing</strong> AssignmentDue July 6, 2012From our data, we were able to figure out the exact relationship between position and time and obtained theacceleration value from our analysis. The point of graphing is to find the average for the data. You should avoidsimply picking a set of points in the table and calculating an average value. This is not proper lab technique andwill get you in trouble on the <strong>AP</strong> exam. The purpose of graphing is to understand the relationship between twophysical quantities. Therefore, use your graphs to determine other quantities that directly come from the graphs, suchas acceleration.PROBLEM 3We are considering an experiment in which we put a series of masses on a spring and then set the spring/mass systeminto motion. The resulting motion is simple harmonic motion. We measure each mass we place on the spring and theperiod of the SHM. The period is always constant for any one mass. Here is a set of data that was gathered. Graphthe data of Period vs. Mass. Then, linearize the data to determine the proper relationship and apply meaning tothe relationship. Fill in the data table. Plot Period vs. Manipulated Mass and Manipulated Period vs. Mass.Both plots should be linear. Determine the slope (with units) and equation for each linear graph.Mass (kg)Period (s)0.1 0.600.2 0.840.3 1.020.4 1.200.5 1.380.8 1.681.0 1.98SLOPE = _________EQUATION = _______________SLOPE = _________EQUATION = _______________3
<strong>Graphing</strong> AssignmentDue July 6, 2012GR<strong>AP</strong>HING AND THE TI-89 CALCULATORIn this next section, rather than graphing by hand and drawing best-fit lines to determine slope, you will learn to use the“Data-Matrix” App on your TI-89 calculator to enter data, to create a graph of the data, and to use linear regressionfunction to determine the slope. Follow the steps attached to the back of this packet to help you answer thequestions.PROBLEM 4Below is data collected in an experiment to determine the equation for kinetic energy. The kinetic energy values wereobtained be applying the conservation of energy to a cart launched by a spring with a known spring constant.x (m) v 1 (m/s) v 2 (m/s) v 3 (m/s) v ave (m/s) v 2 ave (m/s) 2 E k (J)0 0 0 0 00.0100 0.0621 0.0538 0.0568 0.001290.0150 0.0921 0.0953 0.0977 0.002890.0200 0.135 0.134 0.134 0.005140.0250 0.170 0.174 0.176 0.008030.0300 0.208 0.212 0.206 0.01160.0350 0.246 0.243 0.243 0.01570.0400 0.279 0.277 0.279 0.0206a. Fill in the Blank Columns and enter Average Velocity, Average Velocity Squared, and Kinetic Energyinto the Data Matrix App in the TI-89.b. Plot Kinetic Energy on the y-axis and Average Velocity on the x-axis.* What is the shape of the graph? Write the answer below.c. Plot Kinetic Energy on the y-axis and Average Velocity Squared on the x-axis.* What is the shape of the graph? Write the answer below.d. Based on your observations, determine the slope of the linear plot using the linear regression capabilitiesof your TI-89. Write the value below.e. Based on your observations, what is the KE equation (circle one)? ½ mv 2 ½ mvf. Using your slope for the linear plot, what is the mass of the object used in this study? Write the valuebelow.g. If the elastic energy associated with a spring is ½ kx 2 , then what was the average value for the springconstant, k? Write the value below.4
<strong>Graphing</strong> AssignmentDue July 6, 2012In a second energy study, a cart is launched up an incline of length (L) and inclined a height (H). The Potential Energy(mgh) is determined by applying the law of conservation of energy to a spring ( ½ kx 2 and with a known springconstant) that is compressed varying displacements. The cart traveled different distances (d) on the incline based onthe degree of compressions. The cart height (h) is determined by using proportionality. The results are below.x (m) d (m) h (m) E g (J)0.000 0.00 0 00.0100 0.044 0.00123 0.00370.0150 0.081 0.00227 0.00840.0200 0.134 0.00375 0.01500.0250 0.193 0.00540 0.02350.0300 0.274 0.00767 0.03380.0350 0.349 0.00977 0.04600.0400 0.449 0.0126 0.0601a. Plot Potential energy (E g ) vs. Height (h) on your TI-89.b. Using the linear regression capabilities of the TI-89, determine the slope. Write the value below.c. If the slope represents mg, determine the mass of the cart. Write the value below.As a follow-up experiment, a photogate is used to determine the velocity at various heights. The data is below.d (m) height (m) velocity (m/s) E g (J) E k (J)0 0.000 0.0000.20 0.006 0.3440.30 0.008 0.4130.40 0.011 0.4740.50 0.014 0.5290.60 0.017 0.5780.70 0.020 0.625a. Using the calculated mass from part (c) above and the height in this table, determine the potential energyvalues.b. Using the calculated mass from part (c) above and the velocity from this table, determine the kineticenergy values.c. Make a plot of Kinetic Energy vs. Potential Energy on your TI-89.d. Determine the slope using your TI-89. Write the value below.e. What is the significance of the value of the slope?5
<strong>Graphing</strong> AssignmentDue July 6, 2012PROBLEM 5As a final problem, you will analyze data for simple harmonic motion involving a simple pendulum. Answer thequestions based on the results you obtain by using your graphing calculator.Data TablePart I AmplitudeAmplitude (°)2 1.972Average period (s)5 1.97510 1.97920 1.98430 2.015Part II LengthLength (cm)Average period (s)50 1.45160 1.52470 1.65380 1.78590 1.895100 1.993Part III MassMass (g)Average period (s)100 1.973200 1.997300 1.993Analysis1. Using TI-89 Calculator, plot a graph of pendulum period vs. amplitude in degrees.a. Using “PowerReg” instead of “LinReg”, rounding to 1 significant figure, determine the exponent“b” to which “x” is raised. For example, 0.004 rounds to zero; therefore, y = ax 0 . Likewise, 2.101rounds to 2 (meaning squared) and 0.510 rounds to 0.5 (meaning square root).b. What is the equation for Period vs. Amplitude according to the Power Regression?c. Does the period depend on amplitude? Explain.6
<strong>Graphing</strong> AssignmentDue July 6, 20122. Using TI-89 Calculator, plot a graph of pendulum period T vs. length .a. Using “PowerReg” instead of “LinReg”, rounding to 1 significant figure, determine the exponent“b” to which “x” is raised.b. What is the equation for Period vs. Length according to the Power Regression?c. Does the period appear to depend on length?3. Using TI-89 Calculator, plot the pendulum period vs. mass.a. Using “PowerReg” instead of “LinReg”, rounding to 1 significant figure, determine the exponent“b” to which “x” is raised.b. What is the equation for Period vs. Mass according to the Power Regression?c. Does the period appear to depend on mass? Do you have enough data to answer conclusively?4. To examine more carefully how the period T depends on the pendulum length , create the following twoadditional graphs of the same data: T 2 vs. and T vs. 2 .a. T 2 vs. : Using “PowerReg” instead of “LinReg”, rounding to 1 significant figure, determine theexponent “b” to which “x” is raised.b. T 2 vs. : What is the equation according to the Power Regression?c. T vs. 2 : Using “PowerReg” instead of “LinReg”, rounding to 1 significant figure, determine theexponent “b” to which “x” is raised.d. T vs. 2 : What is the equation according to the Power Regression?5. Using Newton’s laws, we could show that for some pendulums, the period T is related to the length andfree-fall acceleration g byT 2gT2 4g27
<strong>Graphing</strong> AssignmentDue July 6, 2012orDoes one of your graphs support this relationship? Explain. (Hint: Can the term in parentheses be treated as aconstant of proportionality?)8