AP Physics--Graphing
AP Physics--Graphing
AP Physics--Graphing

You also want an ePaper? Increase the reach of your titles
YUMPU automatically turns print PDFs into web optimized ePapers that Google loves.
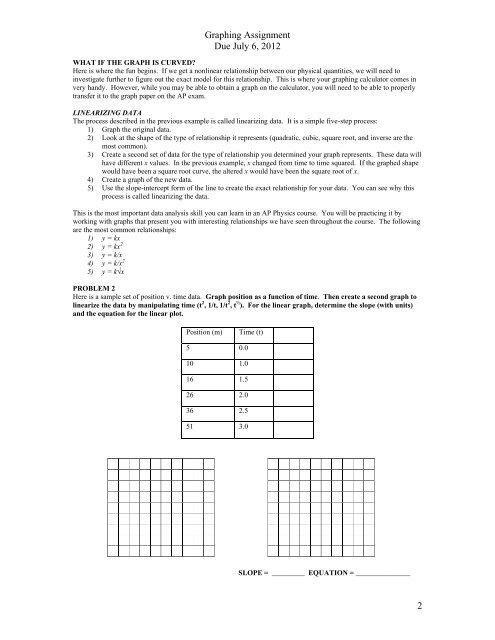
<strong>Graphing</strong> AssignmentDue July 6, 2012WHAT IF THE GR<strong>AP</strong>H IS CURVED?Here is where the fun begins. If we get a nonlinear relationship between our physical quantities, we will need toinvestigate further to figure out the exact model for this relationship. This is where your graphing calculator comes invery handy. However, while you may be able to obtain a graph on the calculator, you will need to be able to properlytransfer it to the graph paper on the <strong>AP</strong> exam.LINEARIZING DATAThe process described in the previous example is called linearizing data. It is a simple five-step process:1) Graph the original data.2) Look at the shape of the type of relationship it represents (quadratic, cubic, square root, and inverse are themost common).3) Create a second set of data for the type of relationship you determined your graph represents. These data willhave different x values. In the previous example, x changed from time to time squared. If the graphed shapewould have been a square root curve, the altered x would have been the square root of x.4) Create a graph of the new data.5) Use the slope-intercept form of the line to create the exact relationship for your data. You can see why thisprocess is called linearizing the data.This is the most important data analysis skill you can learn in an <strong>AP</strong> <strong>Physics</strong> course. You will be practicing it byworking with graphs that present you with interesting relationships we have seen throughout the course. The followingare the most common relationships:1) y = kx2) y = kx 23) y = k/x4) y = k/x 25) y = k√xPROBLEM 2Here is a sample set of position v. time data. Graph position as a function of time. Then create a second graph tolinearize the data by manipulating time (t 2 , 1/t, 1/t 2 , t ½ ). For the linear graph, determine the slope (with units)and the equation for the linear plot.Position (m)Time (t)5 0.010 1.016 1.526 2.036 2.551 3.0SLOPE = _________ EQUATION = _______________2