AP Physics--Graphing
AP Physics--Graphing
AP Physics--Graphing

You also want an ePaper? Increase the reach of your titles
YUMPU automatically turns print PDFs into web optimized ePapers that Google loves.
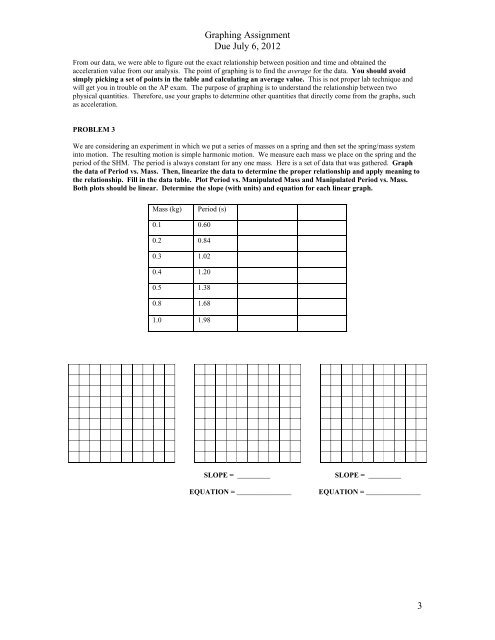
<strong>Graphing</strong> AssignmentDue July 6, 2012From our data, we were able to figure out the exact relationship between position and time and obtained theacceleration value from our analysis. The point of graphing is to find the average for the data. You should avoidsimply picking a set of points in the table and calculating an average value. This is not proper lab technique andwill get you in trouble on the <strong>AP</strong> exam. The purpose of graphing is to understand the relationship between twophysical quantities. Therefore, use your graphs to determine other quantities that directly come from the graphs, suchas acceleration.PROBLEM 3We are considering an experiment in which we put a series of masses on a spring and then set the spring/mass systeminto motion. The resulting motion is simple harmonic motion. We measure each mass we place on the spring and theperiod of the SHM. The period is always constant for any one mass. Here is a set of data that was gathered. Graphthe data of Period vs. Mass. Then, linearize the data to determine the proper relationship and apply meaning tothe relationship. Fill in the data table. Plot Period vs. Manipulated Mass and Manipulated Period vs. Mass.Both plots should be linear. Determine the slope (with units) and equation for each linear graph.Mass (kg)Period (s)0.1 0.600.2 0.840.3 1.020.4 1.200.5 1.380.8 1.681.0 1.98SLOPE = _________EQUATION = _______________SLOPE = _________EQUATION = _______________3