AP Physics--Graphing
AP Physics--Graphing
AP Physics--Graphing

You also want an ePaper? Increase the reach of your titles
YUMPU automatically turns print PDFs into web optimized ePapers that Google loves.
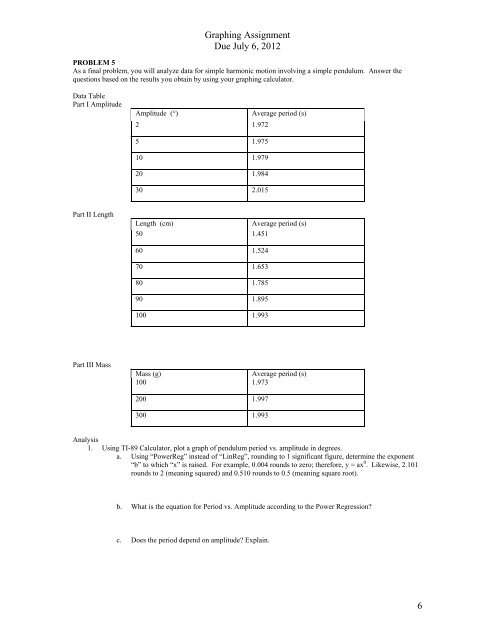
<strong>Graphing</strong> AssignmentDue July 6, 2012PROBLEM 5As a final problem, you will analyze data for simple harmonic motion involving a simple pendulum. Answer thequestions based on the results you obtain by using your graphing calculator.Data TablePart I AmplitudeAmplitude (°)2 1.972Average period (s)5 1.97510 1.97920 1.98430 2.015Part II LengthLength (cm)Average period (s)50 1.45160 1.52470 1.65380 1.78590 1.895100 1.993Part III MassMass (g)Average period (s)100 1.973200 1.997300 1.993Analysis1. Using TI-89 Calculator, plot a graph of pendulum period vs. amplitude in degrees.a. Using “PowerReg” instead of “LinReg”, rounding to 1 significant figure, determine the exponent“b” to which “x” is raised. For example, 0.004 rounds to zero; therefore, y = ax 0 . Likewise, 2.101rounds to 2 (meaning squared) and 0.510 rounds to 0.5 (meaning square root).b. What is the equation for Period vs. Amplitude according to the Power Regression?c. Does the period depend on amplitude? Explain.6