Platinum Wholesale International - Colonial First State
Platinum Wholesale International - Colonial First State
Platinum Wholesale International - Colonial First State

You also want an ePaper? Increase the reach of your titles
YUMPU automatically turns print PDFs into web optimized ePapers that Google loves.
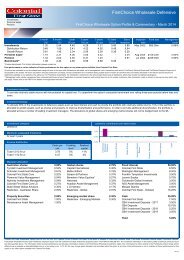
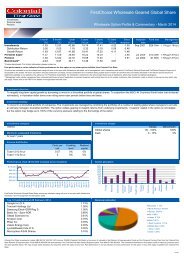
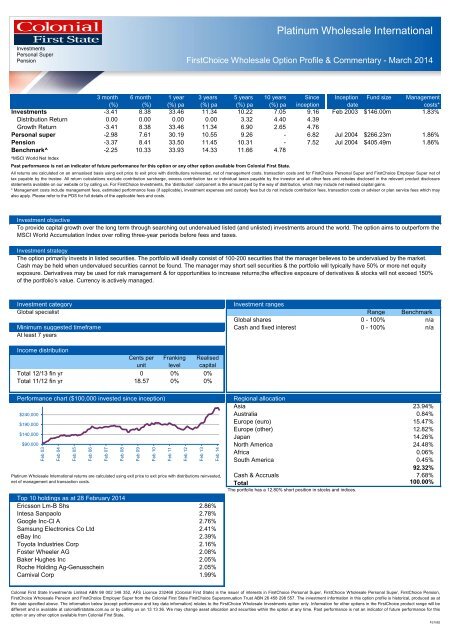
Feb 03Feb 04Feb 05Feb 06Feb 07Feb 08Feb 09Feb 10Feb 11Feb 12Feb 13Feb 14<strong>Platinum</strong> <strong>Wholesale</strong> <strong>International</strong>InvestmentsPersonal SuperPension<strong>First</strong>Choice <strong>Wholesale</strong> Option Profile & Commentary - March 20143 month 6 month 1 year 3 years 5 years 10 years Since Inception Fund size Management(%) (%) (%) pa (%) pa (%) pa (%) pa inception datecosts*Investments -3.41 8.38 33.46 11.34 10.22 7.05 9.16 Feb 2003 $146.00m 1.83%Distribution Return 0.00 0.00 0.00 0.00 3.32 4.40 4.39Growth Return -3.41 8.38 33.46 11.34 6.90 2.65 4.76Personal super -2.98 7.61 30.19 10.55 9.26 - 6.82 Jul 2004 $266.23m 1.86%Pension -3.37 8.41 33.50 11.45 10.31 - 7.52 Jul 2004 $405.49m 1.86%Benchmark^ -2.25 10.33 33.93 14.33 11.66 4.78^MSCI World Net IndexPast performance is not an indicator of future performance for this option or any other option available from <strong>Colonial</strong> <strong>First</strong> <strong>State</strong>.All returns are calculated on an annualised basis using exit price to exit price with distributions reinvested, net of management costs, transaction costs and for <strong>First</strong>Choice Personal Super and <strong>First</strong>Choice Employer Super net oftax payable by the trustee. All return calculations exclude contribution surcharge, excess contribution tax or individual taxes payable by the investor and all other fees and rebates disclosed in the relevant product disclosurestatements available on our website or by calling us. For <strong>First</strong>Choice Investments, the ‘distribution’ component is the amount paid by the way of distribution, which may include net realised capital gains.* Management costs include management fees, estimated performance fees (if applicable), investment expenses and custody fees but do not include contribution fees, transaction costs or adviser or plan service fees which mayalso apply. Please refer to the PDS for full details of the applicable fees and costs.Investment objectiveTo provide capital growth over the long term through searching out undervalued listed (and unlisted) investments around the world. The option aims to outperform theMSCI World Accumulation Index over rolling three-year periods before fees and taxes.Investment strategyThe option primarily invests in listed securities. The portfolio will ideally consist of 100-200 securities that the manager believes to be undervalued by the market.Cash may be held when undervalued securities cannot be found. The manager may short sell securities & the portfolio will typically have 50% or more net equityexposure. Derivatives may be used for risk management & for opportunities to increase returns;the effective exposure of derivatives & stocks will not exceed 150%of the portfolio’s value. Currency is actively managed.Investment categoryInvestment rangesGlobal specialistRange BenchmarkGlobal shares 0 - 100% n/aMinimum suggested timeframe Cash and fixed interest 0 - 100% n/aAt least 7 yearsIncome distributionCents perunitFrankinglevelRealisedcapitalTotal 12/13 fin yr 0 0% 0%Total 11/12 fin yr 18.57 0% 0%Performance chart ($100,000 invested since inception)$240,000$190,000$140,000$90,000<strong>Platinum</strong> <strong>Wholesale</strong> <strong>International</strong> returns are calculated using exit price to exit price with distributions reinvested,net of management and transaction costs.Top 10 holdings as at 28 February 2014Ericsson Lm-B Shs 2.86%Intesa Sanpaolo 2.78%Google Inc-Cl A 2.76%Samsung Electronics Co Ltd 2.41%eBay Inc 2.39%Toyota Industries Corp 2.16%Foster Wheeler AG 2.08%Baker Hughes Inc 2.05%Roche Holding Ag-Genusschein 2.05%Carnival Corp 1.99%Regional allocationAsia 23.94%Australia 0.84%Europe (euro) 15.47%Europe (other) 12.82%Japan 14.26%North America 24.48%Africa 0.06%South America 0.45%92.32%Cash & Accruals 7.68%Total 100.00%The portfolio has a 12.80% short position in stocks and indices.<strong>Colonial</strong> <strong>First</strong> <strong>State</strong> Investments Limited ABN 98 002 348 352, AFS Licence 232468 (<strong>Colonial</strong> <strong>First</strong> <strong>State</strong>) is the issuer of interests in <strong>First</strong>Choice Personal Super, <strong>First</strong>Choice <strong>Wholesale</strong> Personal Super, <strong>First</strong>Choice Pension,<strong>First</strong>Choice <strong>Wholesale</strong> Pension and <strong>First</strong>Choice Employer Super from the <strong>Colonial</strong> <strong>First</strong> <strong>State</strong> <strong>First</strong>Choice Superannuation Trust ABN 26 458 298 557. The investment information in this option profile is historical, produced as atthe date specified above. The information below (except performance and key data information) relates to the <strong>First</strong>Choice <strong>Wholesale</strong> Investments option only. Information for other options in the <strong>First</strong>Choice product range will bedifferent and is available at colonialfirststate.com.au or by calling us on 13 13 36. We may change asset allocation and securities within the option at any time. Past performance is not an indicator of future performance for thisoption or any other option available from <strong>Colonial</strong> <strong>First</strong> <strong>State</strong>.FS1582
<strong>First</strong>Choice <strong>Wholesale</strong> Option ProfileInvestmentsPersonalSuperPension<strong>Platinum</strong> <strong>Wholesale</strong> <strong>International</strong> – 31 March 2014Market reviewMore circumspection crept into the markets as the quarter progressed. Thevaluation-driven gains began to tire as investors assessed the prospect ofhigher rates later in this year and the effect it has on discounting thedistant earnings power of the much-favoured growth stocks. Late in thequarter the two strongest examples, biotechs and mobile internet plays,swooned at this prospect.The emerging markets were not helped by this or by the deterioratingPurchasing Managers’ Index from China which indicates a slowingeconomy. There was also evidence of pressure on housing prices in Chinaand cash flow difficulties have begun to appear among the wealthmanagement products.Encouraging signs of recovery in Europe were spoilt by the fierceengagements in the Ukraine and Crimea, and consequent threats andcounter threats.Fund performance and activityHurting the Fund this quarter was the exposure to the mobile Internetscompanies and Japan. However, gains in India and some of the cyclicalholdings partly offset this and recorded a negative 3% for the quarter but apositive 35% for the rolling 12 months. The Index was -2% for thequarter, nevertheless a substantial +31% for the rolling 12 months.After strong rises from the likes of Naver, Tencent, Baidu and Sina, themanager cut back exposure and took advantage of Yandex, Qiwi, Qunarand Autohome. These companies display high price volatility and tend totreat them as a diversified subset within the portfolio.The strong performers that were sold include FedEx, Las Vegas Sands,Micron Technologies, Cisco, Microsoft and Eurotunnel. Cisco has beenthe only disappointment among these and longer term faces the threatfrom software defined networks. The manager has made small cuts toindividual stock shorts. Overall, the shorts were a benefit this quarter.Outlook and strategyThe principal drivers behind this bull market seem intact.Most economies are expanding and even if China slows, one should notunderestimate Beijing’s willingness to use measures like fiscal stimulus toensure a high level of growth from this now immense economy. Inflationis subdued and in Europe it looks to be particularly low and may cause theECB to consider further loosening measures.The manager continues to find companies that are attractively priced anddespite conflicting headlines see opportunities for stock pickers.This document provides general advice only and is not personal advice. It does not take into account your individual objectives, financial situation or needs. ProductDisclosure <strong>State</strong>ments (PDSs) for all <strong>Colonial</strong> <strong>First</strong> <strong>State</strong> products are available at colonialfirststate.com.au or by contacting Investor Services on 13 13 36 or from yourfinancial adviser. You should read the relevant PDS and assess whether the information in it is appropriate for you, and consider talking to a financial adviser before makingan investment decision. Commonwealth Bank of Australia and its subsidiaries do not guarantee the performance of <strong>Colonial</strong> <strong>First</strong> <strong>State</strong>’s products or the repayment ofcapital by the products. Investments in these products are not deposits or other liabilities of the Commonwealth Bank of Australia or its subsidiaries and investment typeproducts are subject to investment risk including loss of income and capital invested. Information used in this publication, which is taken from sources other than <strong>Colonial</strong><strong>First</strong> <strong>State</strong> is believed to be accurate. Information provided by the Investment Manager are views of the Investment Manager only and can be subject to change. Subject toany contrary provision in any applicable law, neither <strong>Colonial</strong> <strong>First</strong> <strong>State</strong> nor any of its related parties, their employees or directors, provides any warranty of accuracy orreliability in relation to such information or accept any liability to any person who relies on it.