AVSI OVC Project Final Evaluation Children Report
AVSI OVC Project Final Evaluation Children Report
AVSI OVC Project Final Evaluation Children Report
- No tags were found...

Create successful ePaper yourself
Turn your PDF publications into a flip-book with our unique Google optimized e-Paper software.
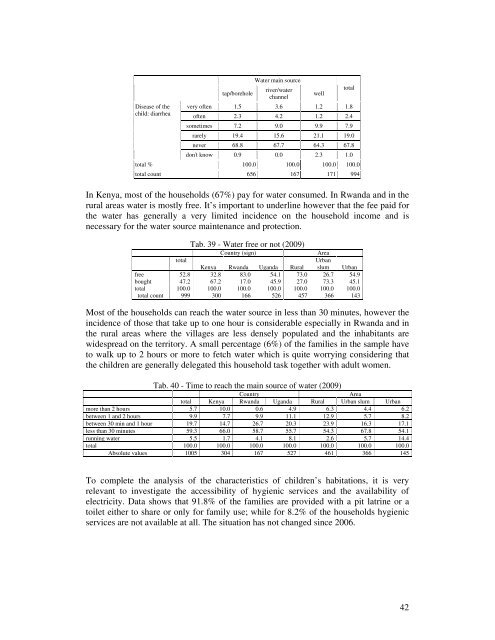
Disease of thechild: diarrheatap/boreholeWater main sourceriver/waterchannelwelltotalvery often 1.5 3.6 1.2 1.8often 2.3 4.2 1.2 2.4sometimes 7.2 9.0 9.9 7.9rarely 19.4 15.6 21.1 19.0never 68.8 67.7 64.3 67.8don’t know 0.9 0.0 2.3 1.0total % 100.0 100.0 100.0 100.0total count 656 167 171 994In Kenya, most of the households (67%) pay for water consumed. In Rwanda and in therural areas water is mostly free. It’ s important to underline however that the fee paid forthe water has generally a very limited incidence on the household income and isnecessary for the water source maintenance and protection.Tab. 39 - Water free or not (2009)Country (sign)AreatotalUrbanKenya Rwanda Uganda Rural slum Urbanfree 52.8 32.8 83.0 54.1 73.0 26.7 54.9bought 47.2 67.2 17.0 45.9 27.0 73.3 45.1total 100.0 100.0 100.0 100.0 100.0 100.0 100.0total count 999 300 166 526 457 366 143Most of the households can reach the water source in less than 30 minutes, however theincidence of those that take up to one hour is considerable especially in Rwanda and inthe rural areas where the villages are less densely populated and the inhabitants arewidespread on the territory. A small percentage (6%) of the families in the sample haveto walk up to 2 hours or more to fetch water which is quite worrying considering thatthe children are generally delegated this household task together with adult women.Tab. 40 - Time to reach the main source of water (2009)CountryAreatotal Kenya Rwanda Uganda Rural Urban slum Urbanmore than 2 hours 5.7 10.0 0.6 4.9 6.3 4.4 6.2between 1 and 2 hours 9.9 7.7 9.9 11.1 12.9 5.7 8.2between 30 min and 1 hour 19.7 14.7 26.7 20.3 23.9 16.3 17.1less than 30 minutes 59.3 66.0 58.7 55.7 54.3 67.8 54.1running water 5.5 1.7 4.1 8.1 2.6 5.7 14.4total 100.0 100.0 100.0 100.0 100.0 100.0 100.0Absolute values 1005 304 167 527 461 366 145To complete the analysis of the characteristics of children’ s habitations, it is veryrelevant to investigate the accessibility of hygienic services and the availability ofelectricity. Data shows that 91.8% of the families are provided with a pit latrine or atoilet either to share or only for family use; while for 8.2% of the households hygienicservices are not available at all. The situation has not changed since 2006.42