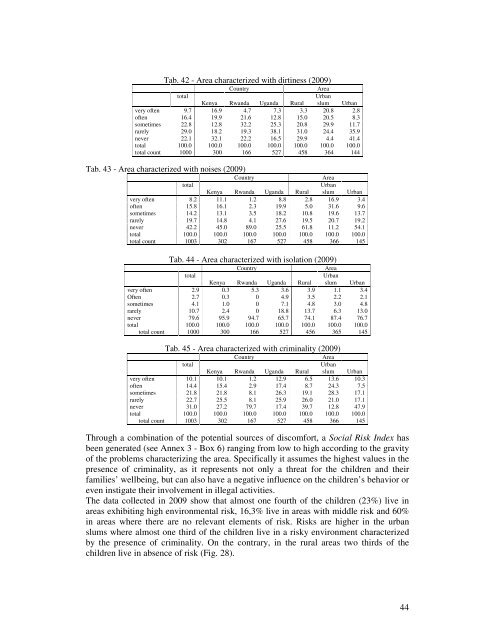
Tab. 42 - Area characterized with dirtiness (2009)CountryAreatotalUrbanKenya Rwanda Uganda Rural slum Urbanvery often 9.7 16.9 4.7 7.3 3.3 20.8 2.8often 16.4 19.9 21.6 12.8 15.0 20.5 8.3sometimes 22.8 12.8 32.2 25.3 20.8 29.9 11.7rarely 29.0 18.2 19.3 38.1 31.0 24.4 35.9never 22.1 32.1 22.2 16.5 29.9 4.4 41.4total 100.0 100.0 100.0 100.0 100.0 100.0 100.0total count 1000 300 166 527 458 364 144Tab. 43 - Area characterized with noises (2009)CountryAreatotalUrbanKenya Rwanda Uganda Rural slum Urbanvery often 8.2 11.1 1.2 8.8 2.8 16.9 3.4often 15.8 16.1 2.3 19.9 5.0 31.6 9.6sometimes 14.2 13.1 3.5 18.2 10.8 19.6 13.7rarely 19.7 14.8 4.1 27.6 19.5 20.7 19.2never 42.2 45.0 89.0 25.5 61.8 11.2 54.1total 100.0 100.0 100.0 100.0 100.0 100.0 100.0total count 1003 302 167 527 458 366 145Tab. 44 - Area characterized with isolation (2009)CountryAreatotalUrbanKenya Rwanda Uganda Rural slum Urbanvery often 2.9 0.3 5.3 3.6 3.9 1.1 3.4Often 2.7 0.3 0 4.9 3.5 2.2 2.1sometimes 4.1 1.0 0 7.1 4.8 3.0 4.8rarely 10.7 2.4 0 18.8 13.7 6.3 13.0never 79.6 95.9 94.7 65.7 74.1 87.4 76.7total 100.0 100.0 100.0 100.0 100.0 100.0 100.0total count 1000 300 166 527 456 365 145Tab. 45 - Area characterized with criminality (2009)CountryAreatotalUrbanKenya Rwanda Uganda Rural slum Urbanvery often 10.1 10.1 1.2 12.9 6.5 13.6 10.3often 14.4 15.4 2.9 17.4 8.7 24.3 7.5sometimes 21.8 21.8 8.1 26.3 19.1 28.3 17.1rarely 22.7 25.5 8.1 25.9 26.0 21.0 17.1never 31.0 27.2 79.7 17.4 39.7 12.8 47.9total 100.0 100.0 100.0 100.0 100.0 100.0 100.0total count 1003 302 167 527 458 366 145Through a combination of the potential sources of discomfort, a Social Risk Index hasbeen generated (see Annex 3 - Box 6) ranging from low to high according to the gravityof the problems characterizing the area. Specifically it assumes the highest values in thepresence of criminality, as it represents not only a threat for the children and theirfamilies’ wellbeing, but can also have a negative influence on the children’ s behavior oreven instigate their involvement in illegal activities.The data collected in 2009 show that almost one fourth of the children (23%) live inareas exhibiting high environmental risk, 16,3% live in areas with middle risk and 60%in areas where there are no relevant elements of risk. Risks are higher in the urbanslums where almost one third of the children live in a risky environment characterizedby the presence of criminality. On the contrary, in the rural areas two thirds of thechildren live in absence of risk (Fig. 28).44
The changes in the SRI during 2006-2009 show some positive trends: in over onefourth of the cases (28,6%) the risks have decreased and in over one third (35%) therisks have remained at low level (Fig. 29)Fig. 27 - Changes in sources of discomfort 2007/09 (%)80,070,066,960,050,040,030,020,042,2 40,330,932,026,9 27,617,016,224,539,436,1Improve dUnchang edWorsened10,00,0dirtiness noises isolation criminalityFig. 28 - Social Risk Index 2009 every area where the child lives (%)80,070,060,050,040,030,020,010,0-75,069,360,042,436,920,723,718,114,9 15,816,36,9Rural Urban slum Urban TotalHigh Risk Middle Risk Low RiskFig. 29– Variation in the Social Risk Index 2006/09 – 9 levels (% on total = 932)stable low34,9very decreased9,0decreased15,5slightly decreased4,2stable middle5,8slightly increased5,9increased5,7very increased11,9stable high7,2- 5,0 10,0 15,0 20,0 25,0 30,0 35,0 40,045
- Page 1 and 2: AVSI OVC ProjectFinal EvaluationChi
- Page 3 and 4: 8.4 Children Profiling for Some Cri
- Page 5 and 6: applying a longitudinal approach. I
- Page 7 and 8: 2.0 Children’s Situation and Vuln
- Page 9 and 10: It’ s important to mention that t
- Page 11 and 12: Tab 2 - Changes in the Child Nutrit
- Page 13 and 14: Tab. 3 Child Health Index every cou
- Page 15 and 16: experienced an improvement, and onl
- Page 17 and 18: Tab. 7 - Change of Child’s person
- Page 19 and 20: 3. EVOLUTION IN THE GUARDIANS’ CH
- Page 21 and 22: service sector, 15 while in Kenya t
- Page 23 and 24: Tab. 12 _ Guardian’ s HIV status
- Page 25 and 26: Fig. 22 - Changes in guardian’ di
- Page 27 and 28: 3.4 Guardian’s involvement in the
- Page 29 and 30: more. The number of children and yo
- Page 31 and 32: Tab. 22 - The family sources of inc
- Page 33 and 34: An increase in AVSI’ s interventi
- Page 35 and 36: higher education levels is very low
- Page 37 and 38: Although urban areas show a higher
- Page 39 and 40: Fig. 34 - Children’ s kind of wor
- Page 41 and 42: 33.1% of the habitations have walls
- Page 43: Tab. 41 - Latrine/toilet in the hou
- Page 47 and 48: Fig. 32- Changes in the Social Risk
- Page 49 and 50: 6.1 Characteristics of the school a
- Page 51 and 52: Tab. 50 - Level of school attended,
- Page 53 and 54: present in the schools attended by
- Page 55 and 56: Tab. 60 - Children attendance at sc
- Page 57 and 58: differences, however younger childr
- Page 59 and 60: their performance are 24,2% and tho
- Page 61 and 62: 8. EVOLUTION IN THE SUPPORT PROVIDE
- Page 63 and 64: Fig. 41 - Support provided by AVSI
- Page 65 and 66: 80,0%70,0%60,0%50,0%40,0%30,0%20,0%
- Page 67 and 68: Part 2Outputs of Multivariate Analy
- Page 69 and 70: the data driven indicators have an
- Page 71 and 72: §¦¨Fig 1 - Multiple Corresponden
- Page 73 and 74: Living conditionFig 2 - Multiple Co
- Page 75 and 76: and live mainly in houses built wit
- Page 77 and 78: ural area, and a further 15% with a
- Page 79 and 80: The Uganda cluster is sub-divided i
- Page 81 and 82: • the state of cleanliness of the
- Page 83 and 84: • 66% of children have three meal
- Page 85 and 86: • Although nutrition is not alway
- Page 87 and 88: VariablesTab 7 - Characterization o
- Page 89 and 90: those who are more than 13 years ol
- Page 91 and 92: VariablesTab 14 - Characterization
- Page 93 and 94: VariablesTab 17 - Characterization
- Page 95 and 96:
Also a group of guardians have wors
- Page 97 and 98:
age of the guardian (6 classes) 36-
- Page 99 and 100:
155 Child’s personality shy 19,86
- Page 101 and 102:
8.5 The Structural Equation ModelTh
- Page 103 and 104:
Guardian’s handicap Ordinal, 3Gua
- Page 105 and 106:
the inner model the dependencies (p
- Page 107 and 108:
Fig 6 - The estimation of WBSI mode
- Page 109 and 110:
with the highest value for WBII is
- Page 111 and 112:
Drivers for WBII0,9000,8000,700AICI
- Page 113 and 114:
Part 3CONCLUSIONS andRECOMMENDATION
- Page 115 and 116:
The research team constructed the s
- Page 117 and 118:
variables of interest, that can be
- Page 119 and 120:
cases the final CGI score does not
- Page 121 and 122:
The high regularity in school atten
- Page 123 and 124:
In this direction, interesting find
- Page 125 and 126:
Aggregations of these scores accord
- Page 127 and 128:
objectives of the OVC program - foo
- Page 129 and 130:
AnnexAnnex 1. OVC POPULATION AND SA
- Page 131 and 132:
Table. 1.3 - Territorial distributi
- Page 133 and 134:
Chart 1 - Children age trend: 2006
- Page 135 and 136:
the questionnaire of 2006. In both
- Page 137 and 138:
Final Evaluation- March 2009QUESTI
- Page 139 and 140:
QUESTI ONS BASED ON THE GUARDI AN
- Page 141 and 142:
K.15 The Household’s sources ofno
- Page 143 and 144:
K.23 The child’s nutritionCough/r
- Page 145 and 146:
nutritional support 1 2 3 9 191recr
- Page 147 and 148:
K.31.2A After your have entered in
- Page 149 and 150:
K.4 When filling this question refe
- Page 151 and 152:
K.27.1K.11.3andK.11.9K.27.1K.4K.11.
- Page 153 and 154:
K.4 On AVSI interventions: Since of
- Page 155 and 156:
Value assigned to vegetables, fruit
- Page 157 and 158:
18005 2 0.2 0.2 50.618050 4 0.3 0.3
- Page 159 and 160:
6 4 0.3 0.5 0.5 Very good8 69 5.4 8
- Page 161 and 162:
1000000205 1 0.1 0.1 80.3 bad100000
- Page 163 and 164:
Distribution Frequency Percent Vali
- Page 165 and 166:
2012 32 2.5 3.2 97.62013 4 0.3 0.4
- Page 167:
Missing System 158 12.3total 1281 1