Mathematics and Mathematical Literacy - Thutong
Mathematics and Mathematical Literacy - Thutong
Mathematics and Mathematical Literacy - Thutong
- No tags were found...
You also want an ePaper? Increase the reach of your titles
YUMPU automatically turns print PDFs into web optimized ePapers that Google loves.
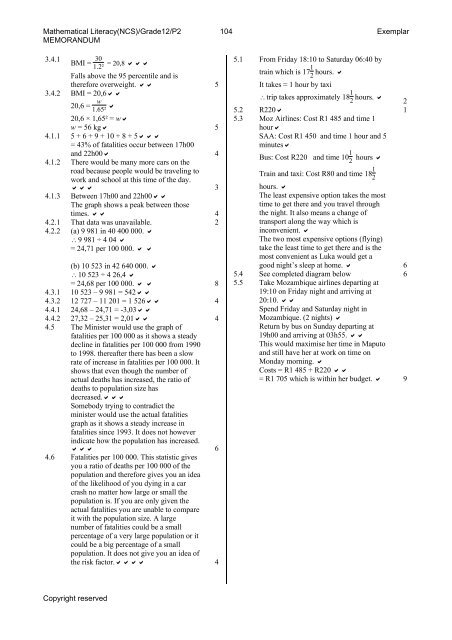
<strong>Mathematical</strong> <strong>Literacy</strong>(NCS)/Grade12/P2 104 ExemplarMEMORANDUM3.4.1BMI = 301.2²= 20,8 Falls above the 95 percentile <strong>and</strong> istherefore overweight. 53.4.2 BMI = 20,6w20,6 =1.65² 20,6 × 1,65² = ww = 56 kg 54.1.1 5 + 6 + 9 + 10 + 8 + 5= 43% of fatalities occur between 17h00<strong>and</strong> 22h00 44.1.2 There would be many more cars on theroad because people would be traveling towork <strong>and</strong> school at this time of the day. 34.1.3 Between 17h00 <strong>and</strong> 22h00The graph shows a peak between thosetimes. 44.2.1 That data was unavailable. 24.2.2 (a) 9 981 in 40 400 000. ∴9 981 ÷ 4 04 = 24,71 per 100 000. (b) 10 523 in 42 640 000. ∴10 523 ÷ 4 26,4 = 24,68 per 100 000. 84.3.1 10 523 – 9 981 = 5424.3.2 12 727 – 11 201 = 1 526 44.4.1 24,68 – 24,71 = -3,034.4.2 27,32 – 25,31 = 2,01 44.5 The Minister would use the graph offatalities per 100 000 as it shows a steadydecline in fatalities per 100 000 from 1990to 1998. thereafter there has been a slowrate of increase in fatalities per 100 000. Itshows that even though the number ofactual deaths has increased, the ratio ofdeaths to population size hasdecreased.Somebody trying to contradict theminister would use the actual fatalitiesgraph as it shows a steady increase infatalities since 1993. It does not howeverindicate how the population has increased. 64.6 Fatalities per 100 000. This statistic givesyou a ratio of deaths per 100 000 of thepopulation <strong>and</strong> therefore gives you an ideaof the likelihood of you dying in a carcrash no matter how large or small thepopulation is. If you are only given theactual fatalities you are unable to compareit with the population size. A largenumber of fatalities could be a smallpercentage of a very large population or itcould be a big percentage of a smallpopulation. It does not give you an idea ofthe risk factor. 45.1 From Friday 18:10 to Saturday 06:40 bytrain which is 17 1 2 hours. It takes ≈ 1 hour by taxi∴trip takes approximately 18 1 2 hours. 25.2 R220 15.3 Moz Airlines: Cost R1 485 <strong>and</strong> time 1hourSAA: Cost R1 450 <strong>and</strong> time 1 hour <strong>and</strong> 5minutesBus: Cost R220 <strong>and</strong> time 10 1 2 hours Train <strong>and</strong> taxi: Cost R80 <strong>and</strong> time 18 1 2hours. The least expensive option takes the mosttime to get there <strong>and</strong> you travel throughthe night. It also means a change oftransport along the way which isinconvenient. The two most expensive options (flying)take the least time to get there <strong>and</strong> is themost convenient as Luka would get agood night’s sleep at home. 65.4 See completed diagram below 65.5 Take Mozambique airlines departing at19:10 on Friday night <strong>and</strong> arriving at20:10. Spend Friday <strong>and</strong> Saturday night inMozambique. (2 nights) Return by bus on Sunday departing at19h00 <strong>and</strong> arriving at 03h55. This would maximise her time in Maputo<strong>and</strong> still have her at work on time onMonday morning. Costs = R1 485 + R220 = R1 705 which is within her budget. 9Copyright reserved


