Structure Plan - Rural City of Murray Bridge
Structure Plan - Rural City of Murray Bridge
Structure Plan - Rural City of Murray Bridge
Create successful ePaper yourself
Turn your PDF publications into a flip-book with our unique Google optimized e-Paper software.
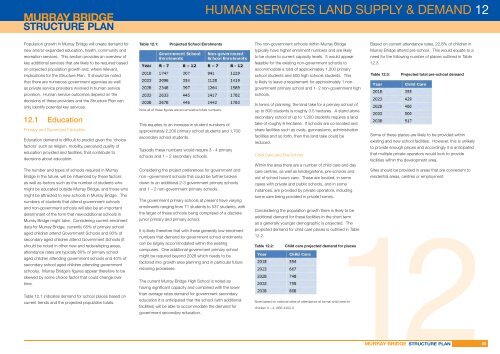
HUMAN SERVICES LAND SUPPLY & DEMAND 12Population growth in <strong>Murray</strong> <strong>Bridge</strong> will create demand fornew and/or expanded education, health, community andrecreation services. This section provides an overview <strong>of</strong>key additional services that are likely to be required basedon projected population growth and, where relevant,implications for the <strong>Structure</strong> <strong>Plan</strong>. It should be notedthat there are numerous government agencies as wellas private service providers involved in human serviceprovision. Human service outcomes depend on thedecisions <strong>of</strong> these providers and the <strong>Structure</strong> <strong>Plan</strong> canonly identify potential key services.12.1 EducationPrimary and Secondary EducationEducation demand is diffi cult to predict given the ‘choicefactors’ such as religion, mobility, perceived quality <strong>of</strong>education provided and facilities, that contribute todecisions about education.The number and types <strong>of</strong> schools required in <strong>Murray</strong><strong>Bridge</strong> in the future, will be infl uenced by these factorsas well as factors such as the number <strong>of</strong> students whomight be educated outside <strong>Murray</strong> <strong>Bridge</strong>, and those whomight be attracted to new schools in <strong>Murray</strong> <strong>Bridge</strong>. Thenumbers <strong>of</strong> students that attend government schoolsand non-government schools will also be an importantdeterminant <strong>of</strong> the form that new/additional schools in<strong>Murray</strong> <strong>Bridge</strong> might take. Considering current enrolmentdata for <strong>Murray</strong> <strong>Bridge</strong>, currently 65% <strong>of</strong> primary schoolaged children attend Government Schools and 80% <strong>of</strong>secondary aged children attend Government Schools (itshould be noted in other new and redeveloping areas,attendance rates are typically 60% <strong>of</strong> primary schoolaged children attending government schools and 40% <strong>of</strong>secondary school aged children attending governmentschools). <strong>Murray</strong> <strong>Bridge</strong>’s fi gures appear therefore to beskewed by some choice factor that could change overtime.Table 12.1 indicates demand for school places based oncurrent trends and the projected population totals.Table 12.1: Projected School EnrolmentsNote all <strong>of</strong> these fi gures are accumulative totals numbers.This equates to an increase in student numbers <strong>of</strong>approximately 2,200 primary school students and 1,700secondary school students.Typically these numbers would require 3 - 4 primaryschools and 1 – 2 secondary schools.Considering the project preferences for government andnon –government schools this could be further brokendown to an additional 2-3 government primary schoolsand 1 – 2 non-government primary schools.The government primary schools at present have varyingenrolments ranging from 71 students to 537 students, withthe larger <strong>of</strong> these schools being comprised <strong>of</strong> a discretejunior primary and primary school.It is likely therefore that with these generally low enrolmentnumbers that demand for government school enrolmentscan be largely accommodated within the existingcampuses. One additional government primary schoolmight be required beyond 2028 which needs to befactored into growth area planning and in particular futurerezoning processes.The current <strong>Murray</strong> <strong>Bridge</strong> High School is noted ashaving signifi cant capacity and combined with the lowerthan average rates demand for government secondaryeducation it is anticipated that the school (with additionalfacilities) will be able to accommodate the demand forgovernment secondary education.The non-government schools within <strong>Murray</strong> <strong>Bridge</strong>typically have higher enrolment numbers and are likelyto be closer to current capacity levels. It would appearfeasible for the existing non-government schools toBased on current attendance rates, 22.8% <strong>of</strong> children in<strong>Murray</strong> <strong>Bridge</strong> attend pre-school. This would equate to aneed for the following number <strong>of</strong> places outlined in Table12.3.accommodate a total <strong>of</strong> approximately 1,200 primaryschool students and 500 high schools students. ThisTable 12.3: Projected total pre-school demandis likely to leave a requirement for approximately 1 nongovernmentprimary school and 1- 2 non-government highschools.In terms <strong>of</strong> planning, the land take for a primary school <strong>of</strong>up to 800 students is roughly 3.5 hectares. A stand alonesecondary school <strong>of</strong> up to 1,200 students requires a landtake <strong>of</strong> roughly 8 hectares. If schools are co-located andshare facilities such as ovals, gymnasiums, administrationfacilities and so forth, then this land take could bereduced.Some <strong>of</strong> these places are likely to be provided withinexisting and new school facilities. However, this is unlikelyto provide enough places and accordingly it is anticipatedChild Care and Pre-Schoolthat multiple private operators would look to providefacilities within the development area.Within the area there are a number <strong>of</strong> child care and daycare centres, as well as kindergartens, pre-schools andout <strong>of</strong> school hours care. These are located, in someSites should be provided in areas that are convenient toresidential areas, centres or employment.cases with private and public schools, and in someinstances, are provided by private operators, includingsome care being provided in private homes.Condsidering the population growth there is likely to beadditional demand for these facilities in the short termas a generally younger demographic is projected. The12projected demand for child care places is outlined in Table12.2.Table 12.2: Child care projected demand for placesNote based on national rates <strong>of</strong> attendance at formal child care forchildren 0 – 4, ABS 4402.045


