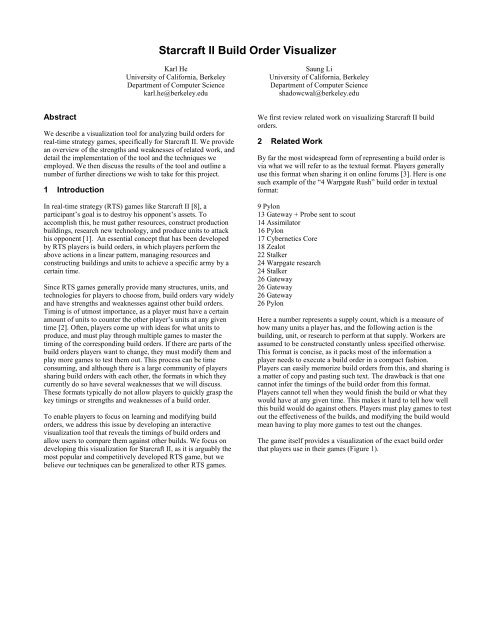
Starcraft II Build Order Visualizer - Visualization - University of ...
Starcraft II Build Order Visualizer - Visualization - University of ...
Starcraft II Build Order Visualizer - Visualization - University of ...

Create successful ePaper yourself
Turn your PDF publications into a flip-book with our unique Google optimized e-Paper software.
<strong>Starcraft</strong> <strong>II</strong> <strong>Build</strong> <strong>Order</strong> <strong>Visualizer</strong>Karl He<strong>University</strong> <strong>of</strong> California, BerkeleyDepartment <strong>of</strong> Computer Sciencekarl.he@berkeley.eduSaung Li<strong>University</strong> <strong>of</strong> California, BerkeleyDepartment <strong>of</strong> Computer Scienceshadowcwal@berkeley.eduAbstractWe describe a visualization tool for analyzing build orders forreal-time strategy games, specifically for <strong>Starcraft</strong> <strong>II</strong>. We providean overview <strong>of</strong> the strengths and weaknesses <strong>of</strong> related work, anddetail the implementation <strong>of</strong> the tool and the techniques weemployed. We then discuss the results <strong>of</strong> the tool and outline anumber <strong>of</strong> further directions we wish to take for this project.1 IntroductionIn real-time strategy (RTS) games like <strong>Starcraft</strong> <strong>II</strong> [8], aparticipant’s goal is to destroy his opponent’s assets. Toaccomplish this, he must gather resources, construct productionbuildings, research new technology, and produce units to attackhis opponent [1]. An essential concept that has been developedby RTS players is build orders, in which players perform theabove actions in a linear pattern, managing resources andconstructing buildings and units to achieve a specific army by acertain time.Since RTS games generally provide many structures, units, andtechnologies for players to choose from, build orders vary widelyand have strengths and weaknesses against other build orders.Timing is <strong>of</strong> utmost importance, as a player must have a certainamount <strong>of</strong> units to counter the other player’s units at any giventime [2]. Often, players come up with ideas for what units toproduce, and must play through multiple games to master thetiming <strong>of</strong> the corresponding build orders. If there are parts <strong>of</strong> thebuild orders players want to change, they must modify them andplay more games to test them out. This process can be timeconsuming, and although there is a large community <strong>of</strong> playerssharing build orders with each other, the formats in which theycurrently do so have several weaknesses that we will discuss.These formats typically do not allow players to quickly grasp thekey timings or strengths and weaknesses <strong>of</strong> a build order.To enable players to focus on learning and modifying buildorders, we address this issue by developing an interactivevisualization tool that reveals the timings <strong>of</strong> build orders andallow users to compare them against other builds. We focus ondeveloping this visualization for <strong>Starcraft</strong> <strong>II</strong>, as it is arguably themost popular and competitively developed RTS game, but webelieve our techniques can be generalized to other RTS games.We first review related work on visualizing <strong>Starcraft</strong> <strong>II</strong> buildorders.2 Related WorkBy far the most widespread form <strong>of</strong> representing a build order isvia what we will refer to as the textual format. Players generallyuse this format when sharing it on online forums [3]. Here is onesuch example <strong>of</strong> the “4 Warpgate Rush” build order in textualformat:9 Pylon13 Gateway + Probe sent to scout14 Assimilator16 Pylon17 Cybernetics Core18 Zealot22 Stalker24 Warpgate research24 Stalker26 Gateway26 Gateway26 Gateway26 PylonHere a number represents a supply count, which is a measure <strong>of</strong>how many units a player has, and the following action is thebuilding, unit, or research to perform at that supply. Workers areassumed to be constructed constantly unless specified otherwise.This format is concise, as it packs most <strong>of</strong> the information aplayer needs to execute a build order in a compact fashion.Players can easily memorize build orders from this, and sharing isa matter <strong>of</strong> copy and pasting such text. The drawback is that onecannot infer the timings <strong>of</strong> the build order from this format.Players cannot tell when they would finish the build or what theywould have at any given time. This makes it hard to tell how wellthis build would do against others. Players must play games to testout the effectiveness <strong>of</strong> the builds, and modifying the build wouldmean having to play more games to test out the changes.The game itself provides a visualization <strong>of</strong> the exact build orderthat players use in their games (Figure 1).
Figure 1: In the post-game screen, <strong>Starcraft</strong> <strong>II</strong> players can view the initial build orders <strong>of</strong> each player involved. The exact supply and timethat each unit was built is apparent. However, the lack <strong>of</strong> horizontal alignment and the strictly tabular format makes it difficult to comparetwo build orders, or easily create a mental image <strong>of</strong> what is happening.Figure 2: The sc2replayed version <strong>of</strong> the build order comparison is much more intuitive. Research timings are included and actions arehorizontally aligned. However, it still suffers many <strong>of</strong> the same problems as the built-in visualizer.Along with supply counts, this built-in visualization also showsthe timings <strong>of</strong> each action so that players can tell what they havedone by a given time. The problem is only the start times <strong>of</strong>actions are displayed, so we cannot see when they are completed.Additionally, if we want to know what players have at a certaintime, we would first have to locate that time and then counteverything upwards and remember the actions. This makes theside-by-side comparison <strong>of</strong> build orders difficult as players needto locate the time they want for both builds and then remembereverything that has happened up to that point. Also, this does not
show some <strong>of</strong> the in-game actions such as transferring workers,dropping mules, chronoboost, and more.www.sc2replayed.com provides another visualization for buildorders, showing builds that players have used (Figure 2).The main advantage <strong>of</strong> this visualization is that the timings <strong>of</strong>actions are aligned horizontally so that we can easily see whateach player as done at given times. However, the supply countsare missing, and this visualization suffers from many <strong>of</strong> thedisadvantages mentioned in the built-in one, such as not knowingthe completion times, the total counts <strong>of</strong> units up to a given point,and not showing certain actions.www.sc2calc.org provides a tool where users can input a buildorder in textual format and it generates a table <strong>of</strong> the actionsperformed along with their corresponding timings, supplies, andresources available [4]. Although this provides more informationabout the state <strong>of</strong> the game, it is still hard to visualize all thetimings at once, as there is a lot <strong>of</strong> cluttered text. The completiontimes provided are hard to analyze, as players need to rememberthem and look forward in time to see what has happened fromstart to completion time. The tool also does not provide a way tocompare two build orders at once.It is worthwhile to note that <strong>of</strong> the 3 tools described, the first twopull their information from analyzing replays <strong>of</strong> actual games.The sc2calc.org tool instead allows users to manually specify thebuild order using an input system derived from the textual buildorders previously described. This system allows for much moreinteractivity, and shared many aspects with the new tool we wereplanning to develop. We ultimately decided to build upon theirtool rather than rebuild the system from scratch.3 MethodsOur goal is to convert build orders from a textual format to avisualization that addresses the above problems. Morespecifically, we want to expose the start and completion times <strong>of</strong>all actions and make it easy to compare what two different buildorders have at any given time. We want users to be able to saveand access builds in textual format so they can generatevisualizations from them at any time. This maintains theportability <strong>of</strong> text, as users can still share build orders via copyand pasting.We strongly believe in the importance <strong>of</strong> the community indeveloping build orders, and therefore the importance <strong>of</strong> beingable to easily access the tool. Using the web and Protovis [5] as amedium for our work was the best fit to these goals.3.1 InputSince the textual format is most widely used and is easily shared,we develop this tool to take in as input a build order in thatformat. From here, calculations need to be done to determine theresources that the player has, start and completion times, supplycounts, and actions performed. Comprehensive work has alreadybeen done on this by Jasper A. Visser, as displayed in his buildorder calculator tool at www.sc2calc.org.Impressed by Visser’s work, we decided to use it as the parser forour system. As sc2calc.org does not have any sort <strong>of</strong> API, weinstead utilized a PHP page to capture the results <strong>of</strong> POSTrequests we send to his tool. When the page generates the table,we fetch the html, parse all the information in the table,encapsulate it in JavaScript data structures that can be easily usedby our system. We can now use this data to generatevisualizations, using textual build orders as input.3.2 Saving build ordersWe create a tree to visualize all <strong>of</strong> the stored build orders. Theroot is the name <strong>of</strong> the tree, and it has three children, one for eachrace. The children <strong>of</strong> a race node are the build orders in textualformat corresponding to that race. The name <strong>of</strong> a build is thename <strong>of</strong> the node. A user who is searching for a specific build cantoggle the race nodes to hide irrelevant nodes and look for thebuild’s name. Hovering over the name <strong>of</strong> a build shows the buildorder in textual format next to the cursor to remind users <strong>of</strong> whatit is. Clicking on a build from the tree will highlight it red and fillin the input box with that build and name. Users can then performvisualizations or modify the build and overwrite it. Users can alsochoose to delete the build from the tree.Note that we did not implement a database for saving since we arefocusing on the visualization aspect <strong>of</strong> the tool, so refreshing thebrowser will erase saved builds.3.3 Unit cheat sheetOne weakness <strong>of</strong> using textual build orders as the input system isthe verbosity <strong>of</strong> the input method. Visser’s system in particular isfairly strict in terms <strong>of</strong> the input, and does not allow abbreviations<strong>of</strong> any sort, nor does it make any assumptions about actions theplayers take that may seem natural. An example <strong>of</strong> this can bedemonstrated by the line “14 Assimilator, and put 3 workers ongas”. The Assimilator is a structure <strong>of</strong> the Protoss faction whichallows players to gather the resource vespene gas. It is typicallynot explicitly stated that a player must order his workers toharvest the vespene and is rather implied by the fact that theAssimilator would not be constructed without the intention <strong>of</strong>using it.Despite its weaknesses, textual input still remains the best way totransmit build orders. While we cannot wholly solve theweaknesses, we can alleviate the need to remember exactspellings, as well as the need to input large quantities <strong>of</strong> text. Weaccomplish this by providing unit portraits categorized by racethat users <strong>of</strong> our tool can click on to quickly input units into oursystem. This could be further extended to also perform actionssuch as transferring workers and swapping add-ons, some <strong>of</strong> themore common and most wordy actions that can be expressed inVisser’s syntax.3.4 <strong>Build</strong> order visualizationOur approach to displaying a build order is reminiscent <strong>of</strong> a Ganttchart, which is used to illustrate the start and end dates <strong>of</strong> theelements <strong>of</strong> a project [6]. Our display consists <strong>of</strong> a verticaltimeline in-between the two build orders and time barsrepresenting the start and completion times <strong>of</strong> performing anaction. Our major deviation from how a Gantt chart is displayed isthat a Gantt chart organizes the bars into projects. Ourvisualization requires no such distinction, and it in fact wouldbecome a visual impedance to have a new column for each newaction that was performed. We instead chose to use the minimalamount <strong>of</strong> columns necessary. The maximum number <strong>of</strong> columnswe use is the same as the maximum number <strong>of</strong> actions that aresimultaneously performed in the build order.
Figure 3: The input box for our build order visualization tool.Figure 4: The visualization for our build order visualization tool. This example shows the 4gate build versus the 1-1-1 build.Additional elements we felt were important to display were thesupply counts when each action is performed, as well ascumulative information at any given time in the build order. Wefelt it was important for supply counts to be visible at all times,since they are a vital part <strong>of</strong> how build orders are remembered andunderstood by players. We decided to display the supply countdirectly on the time bars. Although this adds some visual clutter,the utility it gives is far greater than the cost.The cumulative information we wanted to display were the unitseach build order has produced, as well as some measure <strong>of</strong> theeconomic power <strong>of</strong> each build order. We chose to incorporate thisvia an interactive hover-box that followed the mouse’s position onthe timeline. This gives intuitive context to the current units andresources being displayed by the hover-box, withoutunnecessarily cluttering the display.
4 Results4.1 Inputting <strong>Build</strong> <strong>Order</strong>sThe textual format <strong>of</strong> builds used as input for our tool must be thesame as the one used in sc2calc.org. That site provides a syntaxguide for the input format [4] that can be used for our tool.To assist users in inputting units and buildings as text, we provideimages <strong>of</strong> all <strong>of</strong> them in the “Unit Cheat Sheet” section. Clickingon them will input their corresponding names with spaces beforeand after them into the end <strong>of</strong> the text box. This can assist playerswith remembering and inputting the names <strong>of</strong> units, and can speedup the process <strong>of</strong> inputting a build. The drop-down list allowsusers to toggle between the different races. Organization by racesis most logical as no build order will utilize multiple races.After inputting a textual build order, the user can select “Show onLeft” or “Show on Right” to generate a visualization <strong>of</strong> the buildon the bottom left or bottom right, respectively. Doing this willnot save the build order. To do so, the user can input a name forthe build and save it so that it can be retrieved again. If an input isentered incorrectly, the user is notified <strong>of</strong> the problem.4.2 Saving <strong>Build</strong> <strong>Order</strong>sThe “Saved <strong>Build</strong> <strong>Order</strong>s” stores some example build orders aswell as any build orders saved by the user <strong>of</strong> the tool, stored in atree structure organized by race. <strong>Build</strong> orders are saved by name,the contents <strong>of</strong> which can be revealed by hovering over the name<strong>of</strong> the build order. Selecting a build order loads it into the inputfield, and also allows the user to delete the saved build.4.3 Reading the <strong>Visualization</strong>To prevent too many parallel rows <strong>of</strong> actions, the time bars arecollapsed into the minimum necessary columns. Each time barincludes an image <strong>of</strong> the unit, building, research, or other actiontaken, and the supply count is displayed below the image.Hovering over the image will display the name <strong>of</strong> the action orunit in a tooltip. The time bars are color-coded according towhether the action taken is producing a worker, unit, or building,or performing another action such as researching technology ortransferring workers. We used the selected colors fromColorbrewer’s qualitative-set1 color scheme so that the text andimages are still readable and the colors are easily differentiated.By color coding these categories, players can easily focus on onecategory and compare actions and associated timings in it betweenthe two build orders. A legend for the colors is unnecessary, asplayers can immediately recognize what they stand for. Thesetime bars allow users to see what is completed and currently inproduction at any given time.In the center <strong>of</strong> the visualization is a timeline representing gametime. The timeline is aligned to both build orders displayed,making it easy to compare the timings <strong>of</strong> each build. When theuser hovers over the timeline, a box displays under the cursorshowing the time and images <strong>of</strong> the resources, supplies, units,buildings, and research completed up to that time. The images areorganized so that units appear in the first row, then buildings inthe second, and then all other actions such as research andtransferring workers in the third. Images are shown multiple timesaccording to how many <strong>of</strong> that action is taken or unit is controlled,so that users can easily compare strengths and weaknessesbetween builds. The image <strong>of</strong> workers are displayed once, with acounter next to it, since most builds generally produce manyworkers. This hover-box feature enables users to see everythingthat each build order has at any given time.5 DiscussionWe did not undertake a formal usability study <strong>of</strong> our system, butwe allowed several StarCraft players to try out the tool. Animportant test to perform would be to see how long it takes forplayers to understand and modify particular build orders using ourvisualization. We can then compare these times with similar-levelplayers who use other formats such as the textual one. The maindifficulty in carrying out this test is searching for players withsimilar experience and who do not already know the build ordersbeing shown.Upon sharing our prototype with the community, reception to oursystem has generally been positive. The most common problemappears to be in initially understanding how to use the system.Even StarCraft players have difficulty using Visser’s build ordersyntax, which uses several symbols and phrases that typicallydon’t appear in textual build orders, and are rather explained inprose beneath the build order. This difficulty is alleviated by ourcheat sheet <strong>of</strong> units, which generates the text necessary for anaction. After initial criticisms, we added a direct link to the syntaxguide for those unfamiliar with the textual format used.Understanding how to read the visualizations produced alsoremains an issue, although the several StarCraft players we spoketo quickly picked up how to analyze them.Upon overcoming the learning curve <strong>of</strong> inputting build orders,users don’t appear to have any complaints about the way the buildorders are displayed. Users had highly positive comments on thehover-box depicting what each player has at any given time.Visualizing start and complete times and the color coding <strong>of</strong>timeline were also found to be both helpful and aestheticallypleasing. The main problem is when users want to modify a buildorder, they would have to deal with the syntactical issues <strong>of</strong> theinput format again and in-game constraints such as supply limitsand prerequisites for buildings, units, and research. However,coming up with build orders and modifying them to perfect timinghas always been a difficult task, and overall our visualizationsystem acts as a beneficial tool for analyzing the success <strong>of</strong> buildorders with respect to others.6 Future WorkOur initial user studies seem to indicate that our tool’s major weakpoints are its initial learning curve and the lack <strong>of</strong> apparent utility.Future work on this project is therefore centered on giving moreimmediate utility to the user, as well as making the system moreintuitive.6.1 WorkflowMany users were initially confused when presented with oursystem. We hope this can be at least alleviated by making theworkflow <strong>of</strong> our system more apparent. This encompasses usingthe saved build order tree, the input form, and the left/rightdisplay actions. Adding more visual cues and tooltips willhopefully remove the need for lengthy explanations or manuals onthe tool.6.2 ClusteringWhen analyzing a generated visualization <strong>of</strong> a build order, it isuseful to be able to quickly focus on a particular category <strong>of</strong>
objects such as workers, army, buildings, research, and actions sothat they can be easily compared to another build order. Wepartially addressed this issue by color coding these differentcategories. However, an improved algorithm which groups similarobjects by category could greatly improve readability. Forexample, in the visualization <strong>of</strong> a build order, workers could begrouped in the first few columns, units in the next few, thenbuildings, and then research and actions. Doing so could allowusers to easily locate objects within a category. Filtering could beanother option, though generally users would still want to have asense <strong>of</strong> other categories even when focusing on one <strong>of</strong> them.6.3 Dynamic EditsCurrently, users can edit a build order by modifying the text, andthen re-rendering the visualization. An alternative feature whereusers can directly manipulate the timeline to add and removeobjects would make it easier to tweak a build order whilecomparing it with another one in order to perfect a timing. Theability to drag objects into and out <strong>of</strong> the timeline would improveinteractivity and provide the user with greater flexibility inmodifying and visualizing build orders.References1. Real-time strategy. http://en.wikipedia.org/wiki/Realtime_strategy2. <strong>Build</strong> order. http://en.wikipedia.org/wiki/<strong>Build</strong>_order3. Team Liquid. http://wiki.teamliquid.net/starcraft2/Strategy4. Sc2calc. http://sc2calc.org/build_order/5. Protovis. http://vis.stanford.edu/protovis/6. Gantt chart. http://en.wikipedia.org/wiki/Gantt_chart7. Colorbrewer 2. http://colorbrewer2.org/8. <strong>Starcraft</strong> <strong>II</strong>. http://us.blizzard.com/en-us/games/sc2/6.4 SharingAn important aspect <strong>of</strong> our project is the ability to bring existingbuild orders into the system so that users can retrieve them at afuture time. We have provided an interface for saving builds, buthave not implemented the database for permanent storage due totime constraints.A further step would be making it easier to share build orderssaved into our system, which would allow us to feed them backinto the community. Currently, users can copy and paste the text<strong>of</strong> the build orders, which can then be fed as input for ourvisualization. Perhaps we can allow users to share URLs thatdirect them to the visualizations themselves, and allowing them toexport and import their saved build orders. Doing so can help thecommunity effectively communicate and develop new buildorders.7 ConclusionIn this paper, we described a visualization tool for analyzing buildorders for <strong>Starcraft</strong> <strong>II</strong>. We reviewed the strengths and weaknesses<strong>of</strong> related work, and detailed the implementation <strong>of</strong> the tool andtechniques used. We then discussed the results <strong>of</strong> our tool, and,finally, we outlined the several future directions we plan to takethis project into. Since most real-time strategy games have similarfundamental aspects such as structures, technologicaladvancements, attacking units, and building, resource, and timingconstraints, the visualization techniques we used here for <strong>Starcraft</strong><strong>II</strong> can be generalized to other such games.AcknowledgementsWe would like to thank Jasper A. Visser for creating a tool forcalculating optimal timings <strong>of</strong> build orders and writing the syntaxguide. In retrospect, replicating even a lesser imitation <strong>of</strong> hissystem would have been impossible under our time constraints.We would also like to thank Maneesh Agrawala and his Spring2011 CS294 class for guidance and Blizzard for creating greatgames and fostering a wonderful community.