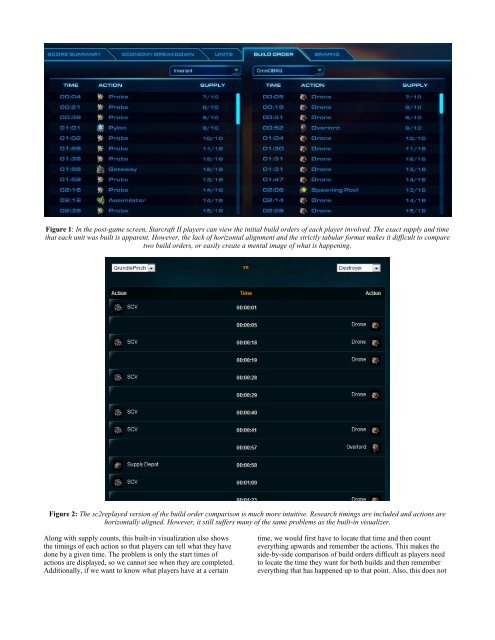
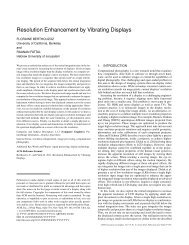
Figure 1: In the post-game screen, <strong>Starcraft</strong> <strong>II</strong> players can view the initial build orders <strong>of</strong> each player involved. The exact supply and timethat each unit was built is apparent. However, the lack <strong>of</strong> horizontal alignment and the strictly tabular format makes it difficult to comparetwo build orders, or easily create a mental image <strong>of</strong> what is happening.Figure 2: The sc2replayed version <strong>of</strong> the build order comparison is much more intuitive. Research timings are included and actions arehorizontally aligned. However, it still suffers many <strong>of</strong> the same problems as the built-in visualizer.Along with supply counts, this built-in visualization also showsthe timings <strong>of</strong> each action so that players can tell what they havedone by a given time. The problem is only the start times <strong>of</strong>actions are displayed, so we cannot see when they are completed.Additionally, if we want to know what players have at a certaintime, we would first have to locate that time and then counteverything upwards and remember the actions. This makes theside-by-side comparison <strong>of</strong> build orders difficult as players needto locate the time they want for both builds and then remembereverything that has happened up to that point. Also, this does not
show some <strong>of</strong> the in-game actions such as transferring workers,dropping mules, chronoboost, and more.www.sc2replayed.com provides another visualization for buildorders, showing builds that players have used (Figure 2).The main advantage <strong>of</strong> this visualization is that the timings <strong>of</strong>actions are aligned horizontally so that we can easily see whateach player as done at given times. However, the supply countsare missing, and this visualization suffers from many <strong>of</strong> thedisadvantages mentioned in the built-in one, such as not knowingthe completion times, the total counts <strong>of</strong> units up to a given point,and not showing certain actions.www.sc2calc.org provides a tool where users can input a buildorder in textual format and it generates a table <strong>of</strong> the actionsperformed along with their corresponding timings, supplies, andresources available [4]. Although this provides more informationabout the state <strong>of</strong> the game, it is still hard to visualize all thetimings at once, as there is a lot <strong>of</strong> cluttered text. The completiontimes provided are hard to analyze, as players need to rememberthem and look forward in time to see what has happened fromstart to completion time. The tool also does not provide a way tocompare two build orders at once.It is worthwhile to note that <strong>of</strong> the 3 tools described, the first twopull their information from analyzing replays <strong>of</strong> actual games.The sc2calc.org tool instead allows users to manually specify thebuild order using an input system derived from the textual buildorders previously described. This system allows for much moreinteractivity, and shared many aspects with the new tool we wereplanning to develop. We ultimately decided to build upon theirtool rather than rebuild the system from scratch.3 MethodsOur goal is to convert build orders from a textual format to avisualization that addresses the above problems. Morespecifically, we want to expose the start and completion times <strong>of</strong>all actions and make it easy to compare what two different buildorders have at any given time. We want users to be able to saveand access builds in textual format so they can generatevisualizations from them at any time. This maintains theportability <strong>of</strong> text, as users can still share build orders via copyand pasting.We strongly believe in the importance <strong>of</strong> the community indeveloping build orders, and therefore the importance <strong>of</strong> beingable to easily access the tool. Using the web and Protovis [5] as amedium for our work was the best fit to these goals.3.1 InputSince the textual format is most widely used and is easily shared,we develop this tool to take in as input a build order in thatformat. From here, calculations need to be done to determine theresources that the player has, start and completion times, supplycounts, and actions performed. Comprehensive work has alreadybeen done on this by Jasper A. Visser, as displayed in his buildorder calculator tool at www.sc2calc.org.Impressed by Visser’s work, we decided to use it as the parser forour system. As sc2calc.org does not have any sort <strong>of</strong> API, weinstead utilized a PHP page to capture the results <strong>of</strong> POSTrequests we send to his tool. When the page generates the table,we fetch the html, parse all the information in the table,encapsulate it in JavaScript data structures that can be easily usedby our system. We can now use this data to generatevisualizations, using textual build orders as input.3.2 Saving build ordersWe create a tree to visualize all <strong>of</strong> the stored build orders. Theroot is the name <strong>of</strong> the tree, and it has three children, one for eachrace. The children <strong>of</strong> a race node are the build orders in textualformat corresponding to that race. The name <strong>of</strong> a build is thename <strong>of</strong> the node. A user who is searching for a specific build cantoggle the race nodes to hide irrelevant nodes and look for thebuild’s name. Hovering over the name <strong>of</strong> a build shows the buildorder in textual format next to the cursor to remind users <strong>of</strong> whatit is. Clicking on a build from the tree will highlight it red and fillin the input box with that build and name. Users can then performvisualizations or modify the build and overwrite it. Users can alsochoose to delete the build from the tree.Note that we did not implement a database for saving since we arefocusing on the visualization aspect <strong>of</strong> the tool, so refreshing thebrowser will erase saved builds.3.3 Unit cheat sheetOne weakness <strong>of</strong> using textual build orders as the input system isthe verbosity <strong>of</strong> the input method. Visser’s system in particular isfairly strict in terms <strong>of</strong> the input, and does not allow abbreviations<strong>of</strong> any sort, nor does it make any assumptions about actions theplayers take that may seem natural. An example <strong>of</strong> this can bedemonstrated by the line “14 Assimilator, and put 3 workers ongas”. The Assimilator is a structure <strong>of</strong> the Protoss faction whichallows players to gather the resource vespene gas. It is typicallynot explicitly stated that a player must order his workers toharvest the vespene and is rather implied by the fact that theAssimilator would not be constructed without the intention <strong>of</strong>using it.Despite its weaknesses, textual input still remains the best way totransmit build orders. While we cannot wholly solve theweaknesses, we can alleviate the need to remember exactspellings, as well as the need to input large quantities <strong>of</strong> text. Weaccomplish this by providing unit portraits categorized by racethat users <strong>of</strong> our tool can click on to quickly input units into oursystem. This could be further extended to also perform actionssuch as transferring workers and swapping add-ons, some <strong>of</strong> themore common and most wordy actions that can be expressed inVisser’s syntax.3.4 <strong>Build</strong> order visualizationOur approach to displaying a build order is reminiscent <strong>of</strong> a Ganttchart, which is used to illustrate the start and end dates <strong>of</strong> theelements <strong>of</strong> a project [6]. Our display consists <strong>of</strong> a verticaltimeline in-between the two build orders and time barsrepresenting the start and completion times <strong>of</strong> performing anaction. Our major deviation from how a Gantt chart is displayed isthat a Gantt chart organizes the bars into projects. Ourvisualization requires no such distinction, and it in fact wouldbecome a visual impedance to have a new column for each newaction that was performed. We instead chose to use the minimalamount <strong>of</strong> columns necessary. The maximum number <strong>of</strong> columnswe use is the same as the maximum number <strong>of</strong> actions that aresimultaneously performed in the build order.