Hyperspectral Vegetation Indices and Their Relationships with ...
Hyperspectral Vegetation Indices and Their Relationships with ...
Hyperspectral Vegetation Indices and Their Relationships with ...
- No tags were found...

Create successful ePaper yourself
Turn your PDF publications into a flip-book with our unique Google optimized e-Paper software.
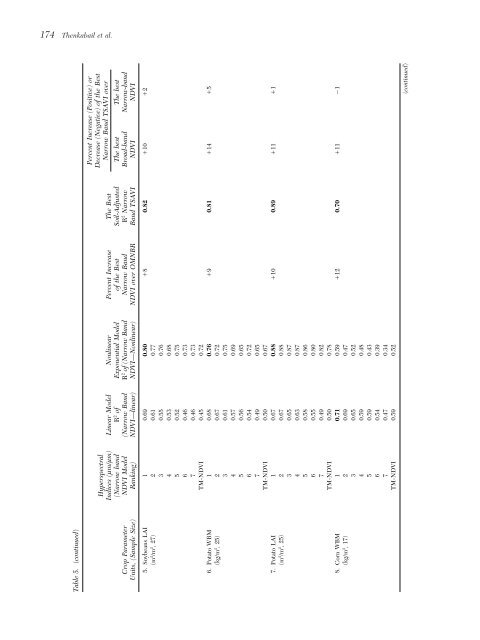
174 Thenkabail et al.Table 5. (continued)<strong>Hyperspectral</strong>Percent Increase (Positive) orDecrease (Negative) of the BestNarrow B<strong>and</strong> TSAVI over<strong>Indices</strong> (lm/lm) Linear Model Nonlinear Percent Increase The Best(Narrow b<strong>and</strong> R 2 of Exponential Model of the Best Soil-Adjusted The best The bestCrop Parameter NDVI Model (Narrow B<strong>and</strong> R 2 of (Narrow B<strong>and</strong> Narrow B<strong>and</strong> R 2 Narrow Broad-b<strong>and</strong> Narrow-b<strong>and</strong>Units, (Sample Size) Ranking) NDVI—linear) NDVI—Nonlinear) NDVI over OMNBR B<strong>and</strong> TSAVI NDVI NDVI5. Soybeans LAI 1 0.69 0.80 8 0.82 10 2(m 2 /m 2 , 27) 2 0.61 0.773 0.55 0.764 0.53 0.685 0.52 0.756 0.46 0.737 0.46 0.73TM-NDVI 0.45 0.726. Potato WBM 1 0.68 0.76 9 0.81 14 5(kg/m 2 , 25) 2 0.67 0.723 0.61 0.754 0.57 0.695 0.56 0.656 0.54 0.727 0.49 0.65TM-NDVI 0.50 0.677. Potato LAI 1 0.67 0.88 10 0.89 11 1(m 2 /m 2 , 25) 2 0.67 0.883 0.65 0.874 0.63 0.875 0.58 0.866 0.55 0.807 0.49 0.82TM-NDVI 0.50 0.788. Corn WBM 1 0.71 0.59 12 0.70 11 1(kg/m 2 , 17) 2 0.69 0.473 0.65 0.524 0.59 0.485 0.59 0.436 0.54 0.397 0.47 0.34TM-NDVI 0.59 0.52(continued)