Hyperspectral Vegetation Indices and Their Relationships with ...
Hyperspectral Vegetation Indices and Their Relationships with ...
Hyperspectral Vegetation Indices and Their Relationships with ...
- No tags were found...

Create successful ePaper yourself
Turn your PDF publications into a flip-book with our unique Google optimized e-Paper software.
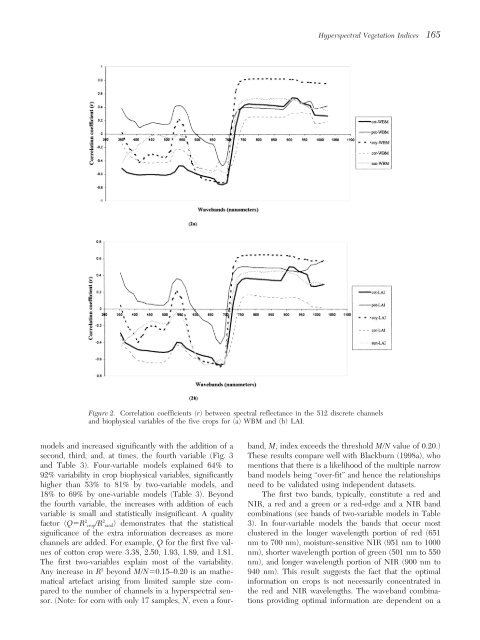
<strong>Hyperspectral</strong> <strong>Vegetation</strong> <strong>Indices</strong> 165Figure 2. Correlation coefficients (r) between spectral reflectance in the 512 discrete channels<strong>and</strong> biophysical variables of the five crops for (a) WBM <strong>and</strong> (b) LAI.models <strong>and</strong> increased significantly <strong>with</strong> the addition of a b<strong>and</strong>, M, index exceeds the threshold M/N value of 0.20.)second, third, <strong>and</strong>, at times, the fourth variable (Fig. 3 These results compare well <strong>with</strong> Blackburn (1998a), who<strong>and</strong> Table 3). Four-variable models explained 64% to mentions that there is a likelihood of the multiple narrow92% variability in crop biophysical variables, significantly b<strong>and</strong> models being “over-fit” <strong>and</strong> hence the relationshipshigher than 53% to 81% by two-variable models, <strong>and</strong> need to be validated using independent datasets.18% to 69% by one-variable models (Table 3). Beyond The first two b<strong>and</strong>s, typically, constitute a red <strong>and</strong>the fourth variable, the increases <strong>with</strong> addition of each NIR, a red <strong>and</strong> a green or a red-edge <strong>and</strong> a NIR b<strong>and</strong>variable is small <strong>and</strong> statistically insignificant. A quality combinations (see b<strong>and</strong>s of two-variable models in Tablefactor (QR 2 crop/R 2 r<strong>and</strong>) demonstrates that the statistical 3). In four-variable models the b<strong>and</strong>s that occur mostsignificance of the extra information decreases as more clustered in the longer wavelength portion of red (651channels are added. For example, Q for the first five val- nm to 700 nm), moisture-sensitive NIR (951 nm to 1000ues of cotton crop were 3.38, 2.50, 1.93, 1.89, <strong>and</strong> 1.81. nm), shorter wavelength portion of green (501 nm to 550The first two-variables explain most of the variability. nm), <strong>and</strong> longer wavelength portion of NIR (900 nm toAny increase in R 2 beyond M/N0.15–0.20 is an mathematical940 nm). This result suggests the fact that the optimalartefact arising from limited sample size com- information on crops is not necessarily concentrated inpared to the number of channels in a hyperspectral sensor.the red <strong>and</strong> NIR wavelengths. The waveb<strong>and</strong> combina-(Note: for corn <strong>with</strong> only 17 samples, N, even a four- tions providing optimal information are dependent ona