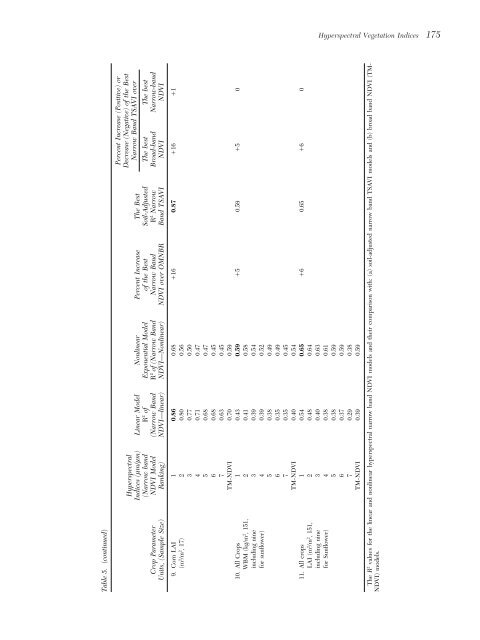
<strong>Hyperspectral</strong> <strong>Vegetation</strong> <strong>Indices</strong> 175Table 5. (continued)<strong>Hyperspectral</strong>Percent Increase (Positive) orDecrease (Negative) of the BestNarrow B<strong>and</strong> TSAVI over<strong>Indices</strong> (lm/lm) Linear Model Nonlinear Percent Increase The Best(Narrow b<strong>and</strong> R 2 of Exponential Model of the Best Soil-Adjusted The best The bestCrop Parameter NDVI Model (Narrow B<strong>and</strong> R 2 of (Narrow B<strong>and</strong> Narrow B<strong>and</strong> R 2 Narrow Broad-b<strong>and</strong> Narrow-b<strong>and</strong>Units, (Sample Size) Ranking) NDVI—linear) NDVI—Nonlinear) NDVI over OMNBR B<strong>and</strong> TSAVI NDVI NDVI9. Corn LAI 1 0.86 0.68 16 0.87 16 1(m 2 /m 2 , 17) 2 0.80 0.563 0.77 0.504 0.71 0.475 0.68 0.476 0.68 0.457 0.63 0.45TM-NDVI 0.70 0.5910. All Crops 1 0.43 0.59 5 0.59 5 0WBM (kg/m 2 , 151, 2 0.41 0.58including nine 3 0.39 0.54for sunflower) 4 0.39 0.525 0.38 0.496 0.35 0.497 0.35 0.45TM-NDVI 0.40 0.5411. All crops 1 0.54 0.65 6 0.65 6 0LAI (m 2 /m 2 , 151, 2 0.48 0.64including nine 3 0.40 0.63for Sunflower) 4 0.38 0.615 0.38 0.596 0.37 0.597 0.29 0.38TM-NDVI 0.39 0.59The R 2 values for the linear <strong>and</strong> nonlinear hyperspectral narrow b<strong>and</strong> NDVI models <strong>and</strong> their comparison <strong>with</strong>: (a) soil-adjusted narrow b<strong>and</strong> TSAVI models <strong>and</strong> (b) broad b<strong>and</strong> NDVI (TM-NDVI) models.
176 Thenkabail et al.tral signature from the cotton lint, cotton leaves that arechanging color from green to light green or yellowishgreen, exposed cotton stems (as a result of falling leaves),<strong>and</strong> some soil background. The narrow b<strong>and</strong> TSAVImodels use slopes <strong>and</strong> intercepts of the soil line to correctfor soil background influences only. However, whenother factors (e.g., lint, stem, <strong>and</strong> different shades ofleaves) become prominent, the soil adjustment can reducethe accuracy of the prediction.Discrimination of Crop Types <strong>and</strong> Growth StagesA knowledge of crop growth stages <strong>and</strong> crop types (Fig.1, Table 1) is critical in underst<strong>and</strong>ing the reflectivity ofdifferent portions of the spectrum. To illustrate this, twoTM indices (broad b<strong>and</strong> NDVI <strong>and</strong> broad b<strong>and</strong> GVI),<strong>and</strong> three hyperspectral indices (a green <strong>and</strong> a blueb<strong>and</strong>-based index: narrow b<strong>and</strong> NDVI1; a green <strong>and</strong> ared b<strong>and</strong>-based index: narrow b<strong>and</strong> NDVI2; <strong>and</strong> a red<strong>and</strong> NIR-based index: narrow b<strong>and</strong> NDVI3) were used(Table 1). Statistical tests of significances were performedon mean vegetation indices of the distinctivegrowth stages (Table 2). The essential notion is that thedistribution of sample data may be used to attach confidencelevels to spectrally separable classes (Wallace <strong>and</strong>Campbell, 1989). The mean broad b<strong>and</strong> NDVI for corn(0.67) <strong>and</strong> cotton (0.66) were about the same (Table 1).Similar insensitivity was detected even when the fourTM b<strong>and</strong>s were used in broad b<strong>and</strong> GVI, which providedvalues of 42.45 for corn <strong>and</strong> 44.06 for cotton. Incomparison, narrow b<strong>and</strong> NDVI1 involving two visibleb<strong>and</strong>s provided significant statistical differences (at 95%confidence level) for corn (0.41) <strong>and</strong> cotton (0.29). Similar,results were obtained using narrow b<strong>and</strong> NDVI2 involvingtwo other visible b<strong>and</strong>s, which had mean valuesof 0.18 for corn <strong>and</strong> 0.11 for cotton. Further, the magni-Other <strong>Indices</strong>When a difference index is formulated using two closelyspaced b<strong>and</strong> centers, it is indicative of the slope of thereflectance <strong>with</strong> respect to wavelength <strong>and</strong> is often re-ferred to as a derivative vegetation index (see Elvidge<strong>and</strong> Chen, 1995). The “bullseye” areas in Figs 4 <strong>and</strong> 5,which are on the diagonal, are ideal for computing hyp-erspectral derivative indices. The first- <strong>and</strong> second-orderderivative spectra (Elvidge <strong>and</strong> Chen, 1995) were also investigated.The best derivative indices in this study ex-plained 35% to 86% variability in different crop variables,but overall performed significantly poorer than thenarrow b<strong>and</strong> <strong>and</strong> most broad b<strong>and</strong> indices discussed inthe previous sections. Hence it is not necessary to reportthese results in detail. There are indications that the de-rivative indices are more sensitive to changes in sparselyvegetated <strong>and</strong> complex (mixture of green <strong>and</strong> brown)grassl<strong>and</strong> canopies (Elvidge <strong>and</strong> Chen, 1995; Curran etal., 1990) rather than for crop canopies.tude of differences in one or the other narrow b<strong>and</strong> indiceswere often higher than broad b<strong>and</strong> NDVI indices.For example, broad b<strong>and</strong> NDVI indices provided significantdifference between soybeans (0.67) <strong>and</strong> potato(0.73) (Table 1). This difference increased when narrowb<strong>and</strong> NDVI2 (0.22 for soybeans <strong>and</strong> 0.33 for sunflower).Overall, the narrow b<strong>and</strong> NDVI2 provided significantdifference between nine combinations of crop types(corn-cotton, corn-potato, corn-sunflower, cotton-potato,cotton-soybean, cotton-sunflower, potato-soybean, potato-sunflower,<strong>and</strong> soybean-sunflower). In comparison,narrow b<strong>and</strong> NDVI1 provided significant difference foronly five combinations, <strong>and</strong> narrow b<strong>and</strong> NDVI3 <strong>with</strong> sixcombinations (Table 1). Compared to this the broadb<strong>and</strong> indices provided significant difference betweenonly three or four combinations of crops. Similar trendscan be observed for the growth stages. For example, thebroad b<strong>and</strong> NDVI indices were about the same for cornin critical (0.67) <strong>and</strong> corn in late vegetative (0.67) (Table1). Compared to this narrow b<strong>and</strong> indices in Table 1show dramatically improved sensitivities. These resultsimply that through the use of indices derived from vari-ous narrow b<strong>and</strong>s it is possible to maximize crop infor-mation. Often information is captured at a specific nar-row b<strong>and</strong> better than the other portions depending onphenological <strong>and</strong> physiographic variability. The resultshere showed narrow b<strong>and</strong>s centered at 0.550, 0.682,0.696, 0.920, <strong>and</strong> 0.468 as most critical for discriminat-ing crops.Dynamic Range <strong>and</strong> Saturation of <strong>Indices</strong>The “saturation” or upward curvature in plots of WBMor LAI versus a two-b<strong>and</strong> vegetation index is a wellknownproblem (e.g., Wieg<strong>and</strong> et al. 1992; Huete et al.,1985). It limits the predictive accuracy of the regressionequations. Our own data, as explained in the followingparagraphs, shows this behavior strongly. The acceptedexplanation for saturation is that in dense vegetation, theleaf coverage approaches 100%, while the biomass <strong>and</strong>LAI continue to grow. Typically, crops reach 100% canopycover around mid-vegetative phases. However, almostall crops continue to accumulate biomass <strong>and</strong> LAIuntil they reach critical phases of growth at which pointthey begin to senesce. NDVI saturates at LAI of 2.5 to3 because the amount of red light that can be absorbedby leaves rapidly reaches a peak. In contrast, NIR scatteringby leaves continues to increase even as LAI exceeds3. As a result, once a canopy reaches 100%, NIRreflectance will continue to rise but red reflectance willshow only modest decreases, resulting in only slightchanges in the ratio (the denominator will have a muchgreater impact on the ratio than the numerator). For ex-ample, consider a canopy that has reached 100%. Redreflectance might be as low as 2%, while NIR could beas high as 50% to 60% depending on the crop (<strong>and</strong> can-