Oparation Manual
Oparation Manual
Oparation Manual
- No tags were found...

You also want an ePaper? Increase the reach of your titles
YUMPU automatically turns print PDFs into web optimized ePapers that Google loves.
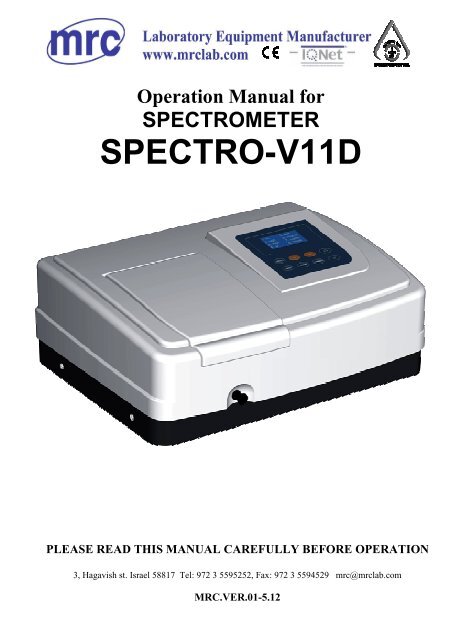
Operation <strong>Manual</strong> forSPECTROMETERSPECTRO-V11DPLEASE READ THIS MANUAL CAREFULLY BEFORE OPERATION3, Hagavish st. Israel 58817 Tel: 972 3 5595252, Fax: 972 3 5594529 mrc@mrclab.comMRC.VER.01-5.12
ContentsSafety ……….……………………………………………………………………. 1General …………………………………………….…….………………………. 1Electrical ………………………………………………..……………………….. 1Warning ………………………………………….…….………………………… 1Working Principle…..………………………….………………………………… 2Unpacking Instructions ……………………………….………………………… 3Specifications…..…………………………………………..…..……….……………3Installation …………………………………………………………..………………. 4Instrument Introduction………………………………………….…………………..4Appearance……………………………………………………………………….4Operating Panel…………………………………………………………………..5Button Description………………………………………………………..……...6Instrument Operation…………………….……………………….….…..………….6Local Software Structure…………… ………………….….…....…………….6Basic operation……………………………………….………..……………….6Measurement………..…………………………………………….…………………7Measure the Absorbance…………………………………….…..…..............7Measure the Transmittance……………………………………………………8Two-points Method……………………………………………………………..9Coefficient Method……………………………………………………………...10Troubleshooting……………………………………………….…….………..………22- 1 -
Shows visible damageFails to perform the intended measurementsHas been subjected to prolonged storage under unfavorable conditionsHas been subjected to severe transport stressesWorking Principle:The spectrophotometer consists of five parts:1) Halogen or deuterium lamp to supply the light;2) A Mono-chromator to isolate the wavelength of interest and eliminate the unwantedsecond order radiation;3) A sample compartment to accommodate the sample solution;4) A detector to receive the transmitted light and convert it to an electrical signal;5) A digital display to indicate absorbance or transmittance. The block diagram (Fig 1-1)below illustrates the relationship between these parts.Block diagram for the Spectrophotometer100%T0 AbsLight Mono- Sample Detector DisplaySource chromator CompartmentFig1-1In your spectrophotometer, light from the lamp is focused on the entrance slit of themonochromator where the collimating mirror directs the beam onto the grating. Thegrating disperses the light beam to produce the spectrum, a portion of which is focused onthe exit slit of the monochromator by a collimating mirror. From here the beam is passedto a sample compartment through one of the filters, which helps to eliminate unwantedsecond order radiation from the diffraction grating. Upon leaving the sample compartment,the beam is passed to the silicon photodiode detector and causes the detector to producean electrical signal that is displayed on the digital display.- 2 -
Unpacking Instructions:Carefully unpack the contents and check the materials against the following packing list toensure that you have received everything in good condition.DescriptionPacking ListQuantity Spectrophotometer ............................................................. 1 Mains Lead ........................................................................... 1 Cuvettes................................................................................ 1 Set of 4, glass <strong>Manual</strong> .................................................................................. 1Specifications:ModelSPECTRO-V11DWavelength Range325-1000nmSpectral Bandwidth4nmOptical SystemSingle Beam, Grating 1200lines/mmWavelength Accuracy±2nmWavelength Repeatability1nmWavelength Resolution0.5nmPhotometric Accuracy±0.5%TPhotometric Repeatability±0.3%TPhotometric Range-0.3-3A, 0-200%TStray Light0.3%T@360nmStability±0.004A/h @500nmDisplayGraphic LCD (128X64 dots)Keyboard4 Button keypadPhotometric ModeT, A, C, FDetectorPhotodiodeSample CompartmentStandard 10mm path length cuvette holderCan accommodates 100mm path length cuvette with optional holderLight SourceTungsten lampOutput USB Port Parallel Port (printer)Power RequirementAC 85V ~ 265VDimensions (W x D x H)480 x 360 x 160mmWeight10 kg- 3 -
1 — Lid of the compartment2 — Cell Holder3 — Pole4 — Operating Panel5 — Wavelength Knob6 — USB Port7 — Print Port8 — Fan Cover9 — Power Socket10— Power SwitchBacksideFig. 3-12. Operating PanelPlease see the panel of SPECTRO-V11D (Fig. 3-2)Fig. 3-2- 5 -
1 — LCD (128 X 64)2 — Key Button3. Button DescriptionSwitch the Photometric ModeConfirm/PrintDecrease Number/Set ZeroIncrease Number/Set 100%TInstrument Operation1. Local Software StructurePlease see Fig. 4-1:图 4-12. BASIC OPERATION1) Select Test ModePress to select the test mode.2) Set WavelengthTurn the Wavelength Setting Knob to select the wavelength you want, the wavelengthValue can be displayed on the screen in real-time.3) Input the CoefficientWhen the system prompts you to input C, k or b, press or button tochange the value till it displays the one you want, then press to confirm.Note: The system will memorize your last input all the time until you input anothervalue.4) Calibrate Zero- 6 -
Fig. 4-35) Press to print the test result;6) Repeat Step 4) and step 5) to test other unknown concentration samples.2. Measure the Transmittance1) Press to choose the mode of “T”(Fig. 4-4);Fig. 4-42) Turn the Wavelength Knob to set the wavelength at the point you want;3) Pull the Reference in the light path,press to calibrate 100%T(Fig. 4-5);Fig. 4-54) Pull the Unknown Concentration Sample in the light path, then the value displayed on thescreen is the one you need.(Fig. 4-6)。- 8 -
Fig. 4-65) Press to print the test result;6) Repeat step 4 and step 5 to test other samples.3. Two-point MethodIf you have known a Standard Sample’s concentration, and you want to know anothersample’s concentration, you can use this method.1) Choose “A” or “T” Mode and turn the wavelength knob to set the wavelength.2) Pull the Reference into the light path, press to get 100%T;3) Pull the Standard sample into the light path and press to choose “C”mode.4) Press or to input the Standard Sample’s Concentration,press to confirm. (Fig. 4-7)Fig. 4-75) Pull the unknown concentration sample in the light path, then its concentration displayson the screen. (Fig.4-8);- 9 -
Fig. 4-86) Press to print the test result.7) Repeat step5) and step 6) to test other samples.4. Coefficient Method1) Turn the Wavelength Knob to set the wavelength at the point you need.2) Press to choose“F” Mode.3) Press or to set the coefficient value of K and B, followed withsteps..pressed to confirm. (Fig. 4-9) Then you can test the samples as the followingFig. 4-94) Pull the Reference in the light path and press to set 100%T(Fig. 4-10);Fig. 4-10- 10 -
5) Pull the samples in the light path. Then its concentration will be displayed on the screen.automatically (Fig.4-11)Fig. 4-116) Press to print the test result.7) Repeat step 5) and step 6) to measure other samples.- 11 -
TroubleshootingPROBLEM Possible Cause SolutionNo functioning Power cord not connected to outlet Plug instrument inafter power is Dead Power outletChange to a different outleton .Internal fuse melted or defectiveelectronic componentChange fuse or call an authorizedservice engineerInstrumentcannot100%T (0A)Light beam blocked:Check sample holderset Holder misalignedLamp is old or defectiveReplace lampLamp is off alignmentReadjust the lampunstable displayincorrectreadingsobtainedDefective electronic component Call an authorized serviceengineerInsufficient warm up timewarm up at least 20 minutesPoor groundingCheck ground connectionExcessive vibration, strong air Improve working conditionscurrent near light source ,or strongexternal light.Lamp old or defectiveReplace with a new lampUnstable power supplyequip a manostat to make thevoltage stableDefective or dirty detector or Call an authorized servicedefective electronic component engineerInsufficient sample volumeFill cuvette with more samplesWrong wavelength settingFailed to blank (0A/100%T)Check analytical procedure andwavelength setting.Stray sample preparation vapors Prepare sample away frominstrument. Use properventilationBubbles or particles in solution Check sample preparation andanalytical procedureInstrument out of electronic Call an authorized servicecalibrationengineer- 12 -