Physical activity statistics 2012 - British Heart Foundation
Physical activity statistics 2012 - British Heart Foundation
Physical activity statistics 2012 - British Heart Foundation
- No tags were found...

Create successful ePaper yourself
Turn your PDF publications into a flip-book with our unique Google optimized e-Paper software.
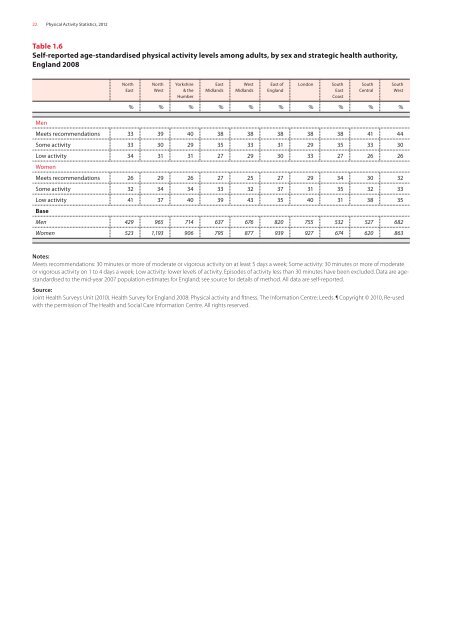
22 <strong>Physical</strong> Activity Statistics, <strong>2012</strong>Table 1.6Self-reported age-standardised physical <strong>activity</strong> levels among adults, by sex and strategic health authority,England 2008NorthEastNorthWestYorkshire& theHumberEastMidlandsWestMidlandsEast ofEnglandLondonSouthEastCoastSouthCentral% % % % % % % % % %MenMeets recommendations 33 39 40 38 38 38 38 38 41 44Some <strong>activity</strong> 33 30 29 35 33 31 29 35 33 30Low <strong>activity</strong> 34 31 31 27 29 30 33 27 26 26WomenMeets recommendations 26 29 26 27 25 27 29 34 30 32Some <strong>activity</strong> 32 34 34 33 32 37 31 35 32 33Low <strong>activity</strong> 41 37 40 39 43 35 40 31 38 35BaseMen 429 965 714 637 676 820 755 532 527 682Women 523 1,193 906 795 877 939 927 674 620 863SouthWestNotes:Meets recommendations: 30 minutes or more of moderate or vigorous <strong>activity</strong> on at least 5 days a week; Some <strong>activity</strong>: 30 minutes or more of moderateor vigorous <strong>activity</strong> on 1 to 4 days a week; Low <strong>activity</strong>: lower levels of <strong>activity</strong>. Episodes of <strong>activity</strong> less than 30 minutes have been excluded. Data are agestandardisedto the mid-year 2007 population estimates for England; see source for details of method. All data are self-reported.Source:Joint Health Surveys Unit (2010). Health Survey for England 2008: <strong>Physical</strong> <strong>activity</strong> and fitness. The Information Centre: Leeds. Copyright © 2010, Re-usedwith the permission of The Health and Social Care Information Centre. All rights reserved.