Physical activity statistics 2012 - British Heart Foundation
Physical activity statistics 2012 - British Heart Foundation
Physical activity statistics 2012 - British Heart Foundation
- No tags were found...

Create successful ePaper yourself
Turn your PDF publications into a flip-book with our unique Google optimized e-Paper software.
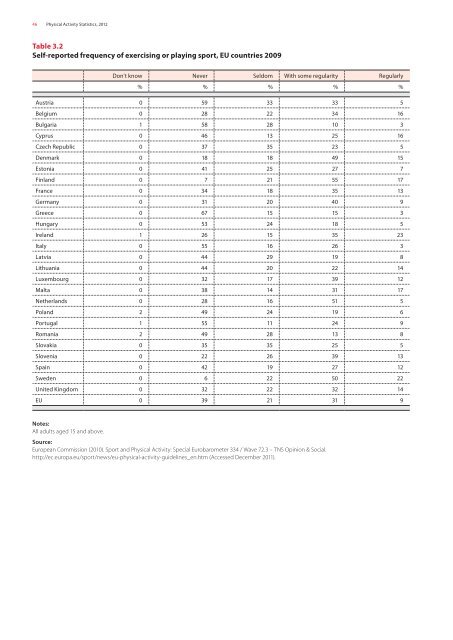
46 <strong>Physical</strong> Activity Statistics, <strong>2012</strong>Table 3.2Self-reported frequency of exercising or playing sport, EU countries 2009Don’t know Never Seldom With some regularity Regularly% % % % %Austria 0 59 33 33 5Belgium 0 28 22 34 16Bulgaria 1 58 28 10 3Cyprus 0 46 13 25 16Czech Republic 0 37 35 23 5Denmark 0 18 18 49 15Estonia 0 41 25 27 7Finland 0 7 21 55 17France 0 34 18 35 13Germany 0 31 20 40 9Greece 0 67 15 15 3Hungary 0 53 24 18 5Ireland 1 26 15 35 23Italy 0 55 16 26 3Latvia 0 44 29 19 8Lithuania 0 44 20 22 14Luxembourg 0 32 17 39 12Malta 0 38 14 31 17Netherlands 0 28 16 51 5Poland 2 49 24 19 6Portugal 1 55 11 24 9Romania 2 49 28 13 8Slovakia 0 35 35 25 5Slovenia 0 22 26 39 13Spain 0 42 19 27 12Sweden 0 6 22 50 22United Kingdom 0 32 22 32 14EU 0 39 21 31 9Notes:All adults aged 15 and above.Source:European Commission (2010). Sport and <strong>Physical</strong> Activity: Special Eurobarometer 334 / Wave 72.3 – TNS Opinion & Social.http://ec.europa.eu/sport/news/eu-physical-<strong>activity</strong>-guidelines_en.htm (Accessed December 2011).