Physical activity statistics 2012 - British Heart Foundation
Physical activity statistics 2012 - British Heart Foundation
Physical activity statistics 2012 - British Heart Foundation
- No tags were found...

Create successful ePaper yourself
Turn your PDF publications into a flip-book with our unique Google optimized e-Paper software.
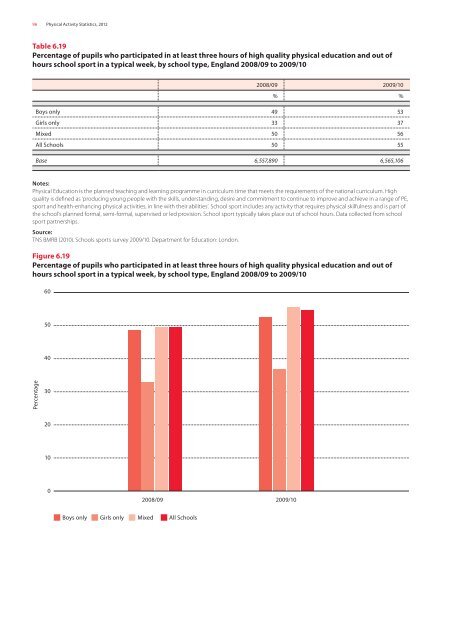
96 <strong>Physical</strong> Activity Statistics, <strong>2012</strong>Table 6.19Percentage of pupils who participated in at least three hours of high quality physical education and out ofhours school sport in a typical week, by school type, England 2008/09 to 2009/102008/09 2009/10% %Boys only 49 53Girls only 33 37Mixed 50 56All Schools 50 55Base 6,557,890 6,565,106Notes:<strong>Physical</strong> Education is the planned teaching and learning programme in curriculum time that meets the requirements of the national curriculum. Highquality is defined as ‘producing young people with the skills, understanding, desire and commitment to continue to improve and achieve in a range of PE,sport and health-enhancing physical activities, in line with their abilities’. School sport includes any <strong>activity</strong> that requires physical skilfulness and is part ofthe school’s planned formal, semi-formal, supervised or led provision. School sport typically takes place out of school hours. Data collected from schoolsport partnerships.Source:TNS BMRB (2010). Schools sports survey 2009/10. Department for Education: London.Figure 6.19Percentage of pupils who participated in at least three hours of high quality physical education and out ofhours school sport in a typical week, by school type, England 2008/09 to 2009/10605040Percentage30201002008/09 2009/10Boys only Girls only Mixed All Schools