Physical activity statistics 2012 - British Heart Foundation
Physical activity statistics 2012 - British Heart Foundation
Physical activity statistics 2012 - British Heart Foundation
- No tags were found...

You also want an ePaper? Increase the reach of your titles
YUMPU automatically turns print PDFs into web optimized ePapers that Google loves.
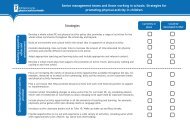
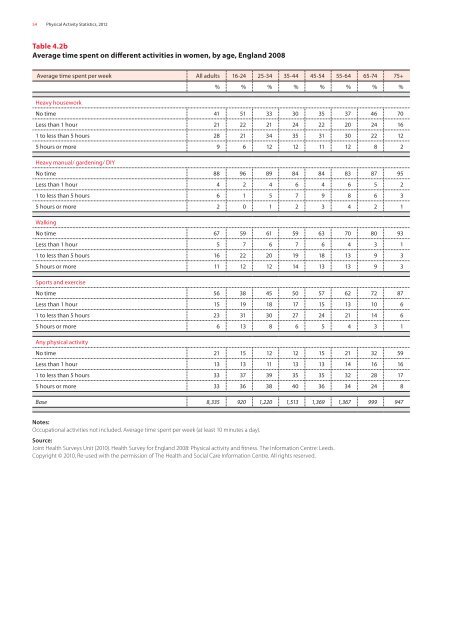
54 <strong>Physical</strong> Activity Statistics, <strong>2012</strong>Table 4.2bAverage time spent on different activities in women, by age, England 2008Average time spent per week All adults 16-24 25-34 35-44 45-54 55-64 65-74 75+% % % % % % % %Heavy houseworkNo time 41 51 33 30 35 37 46 70Less than 1 hour 21 22 21 24 22 20 24 161 to less than 5 hours 28 21 34 35 31 30 22 125 hours or more 9 6 12 12 11 12 8 2Heavy manual/ gardening/ DIYNo time 88 96 89 84 84 83 87 95Less than 1 hour 4 2 4 6 4 6 5 21 to less than 5 hours 6 1 5 7 9 8 6 35 hours or more 2 0 1 2 3 4 2 1WalkingNo time 67 59 61 59 63 70 80 93Less than 1 hour 5 7 6 7 6 4 3 11 to less than 5 hours 16 22 20 19 18 13 9 35 hours or more 11 12 12 14 13 13 9 3Sports and exerciseNo time 56 38 45 50 57 62 72 87Less than 1 hour 15 19 18 17 15 13 10 61 to less than 5 hours 23 31 30 27 24 21 14 65 hours or more 6 13 8 6 5 4 3 1Any physical <strong>activity</strong>No time 21 15 12 12 15 21 32 59Less than 1 hour 13 13 11 13 13 14 16 161 to less than 5 hours 33 37 39 35 35 32 28 175 hours or more 33 36 38 40 36 34 24 8Base 8,335 920 1,220 1,513 1,369 1,367 999 947Notes:Occupational activities not included. Average time spent per week (at least 10 minutes a day).Source:Joint Health Surveys Unit (2010). Health Survey for England 2008: <strong>Physical</strong> <strong>activity</strong> and fitness. The Information Centre: Leeds.Copyright © 2010, Re-used with the permission of The Health and Social Care Information Centre. All rights reserved.