Physical activity statistics 2012 - British Heart Foundation
Physical activity statistics 2012 - British Heart Foundation
Physical activity statistics 2012 - British Heart Foundation
- No tags were found...

Create successful ePaper yourself
Turn your PDF publications into a flip-book with our unique Google optimized e-Paper software.
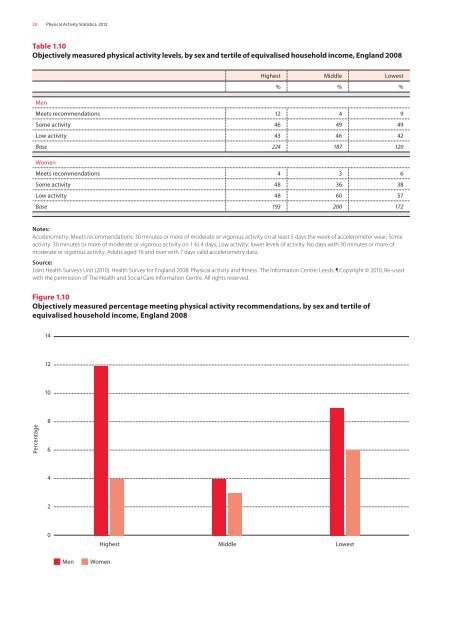
28 <strong>Physical</strong> Activity Statistics, <strong>2012</strong>Table 1.10Objectively measured physical <strong>activity</strong> levels, by sex and tertile of equivalised household income, England 2008Highest Middle Lowest% % %MenMeets recommendations 12 4 9Some <strong>activity</strong> 46 49 49Low <strong>activity</strong> 43 46 42Base 224 187 120WomenMeets recommendations 4 3 6Some <strong>activity</strong> 48 36 38Low <strong>activity</strong> 48 60 57Base 193 200 172Notes:Accelerometry: Meets recommendations: 30 minutes or more of moderate or vigorous <strong>activity</strong> on at least 5 days the week of accelerometer wear; Some<strong>activity</strong>: 30 minutes or more of moderate or vigorous <strong>activity</strong> on 1 to 4 days; Low <strong>activity</strong>: lower levels of <strong>activity</strong>. No days with 30 minutes or more ofmoderate or vigorous <strong>activity</strong>. Adults aged 16 and over with 7 days valid accelerometry data.Source:Joint Health Surveys Unit (2010). Health Survey for England 2008: <strong>Physical</strong> <strong>activity</strong> and fitness. The Information Centre: Leeds. Copyright © 2010, Re-usedwith the permission of The Health and Social Care Information Centre. All rights reserved.Figure 1.10Objectively measured percentage meeting physical <strong>activity</strong> recommendations, by sex and tertile ofequivalised household income, England 2008141210Percentage86420Highest Middle LowestMenWomen