- Page 4 and 5:
Copies of this report may be obtain
- Page 7 and 8:
Socioeconomic information can provi
- Page 10 and 11:
South Wilmington Census block group
- Page 12 and 13:
South Wilmington Census blocks stud
- Page 15:
Table of FiguresFigure 1.1. South W
- Page 19 and 20:
Figure 5.3. Percentages of owner- a
- Page 21 and 22:
Figure 9.1. South Wilmington police
- Page 23 and 24:
Table 4.3. Percent of populations i
- Page 25 and 26:
PrefaceThis socioeconomic profile r
- Page 28 and 29:
Chapter 1: IntroductionThis chapter
- Page 30 and 31:
The South Wilmington SAMP provides
- Page 32 and 33:
Figure 1.2. Illustration of Census
- Page 34 and 35:
South Wilmington Socioeconomic Prof
- Page 36 and 37:
Other dataThroughout this report, d
- Page 38 and 39:
The Christina River watershed also
- Page 40 and 41:
Chapter 8: Public and community dev
- Page 42:
Chapter 2: Demographic and Housing
- Page 45 and 46:
DRAFT: Not for distributionFigure 2
- Page 47 and 48:
DRAFT: Not for distributionIn 2000,
- Page 49:
DRAFT: Not for distributiona. Males
- Page 52 and 53:
South Wilmington City of Wilmington
- Page 54 and 55:
% Local family households80.070.060
- Page 56:
Chapter 3: Demographic Characterist
- Page 59 and 60:
Figure 3.1. The four Census block g
- Page 61 and 62:
Gender distributionIn South Wilming
- Page 63 and 64:
a. Males by age% Local female popul
- Page 65 and 66:
a. Males% Local male population age
- Page 67 and 68:
a. South Wilmington80.070.0MalesFem
- Page 69 and 70:
Household typesThe Census Bureau de
- Page 71 and 72:
45.040.0a. Family households39.737.
- Page 73 and 74:
60.056.954.752.5South WilmingtonCit
- Page 75 and 76:
100.090.094.2 94.1 93.4South Wilmin
- Page 77 and 78: % Local population aged 5 years and
- Page 79 and 80: a. Population aged 5-15 years% Disa
- Page 82 and 83: Chapter 4: Employment and Residenti
- Page 84 and 85: Overall, the majority of the popula
- Page 86 and 87: South WilmingtonCity of WilmingtonN
- Page 88 and 89: % Local employed population18.016.0
- Page 90 and 91: Journey to workThis section present
- Page 92 and 93: % Local workers aged 16 years and o
- Page 94 and 95: 80.070.072.267.866.5South Wilmingto
- Page 96 and 97: 4.b. Residential Income Characteris
- Page 98 and 99: The U.S. Census Bureau defines soci
- Page 100 and 101: 100.090.0South WilmingtonCity of Wi
- Page 102 and 103: a. Residents with incomes below the
- Page 104 and 105: a. Family households100.090.0South
- Page 106: Chapter 5: Residential DevelopmentC
- Page 109 and 110: Figure 5.1. The four Census block g
- Page 111 and 112: Renter versus owner occupancyRenter
- Page 113 and 114: a. Housing units with mortgages60.0
- Page 115 and 116: a. Owner-occupied housing units70.0
- Page 117 and 118: 5.d. Age of Housing UnitsIn 2000, m
- Page 119 and 120: a. Owner-occupied housing units35.0
- Page 121 and 122: 5.f. Housing Unit Facilities and Ut
- Page 123 and 124: Telephone service availability inre
- Page 125 and 126: a. Owner-occupied housing units45.0
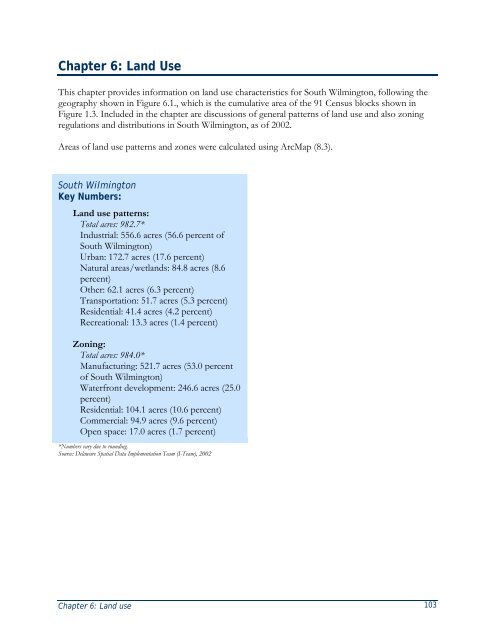
- Page 130 and 131: In 2002, under the Anderson Classif
- Page 132 and 133: Anderson Classification Area (acres
- Page 134 and 135: Chapter 6: Land use 109Figure 6.4.
- Page 136: Chapter 7: Business establishments
- Page 139 and 140: 7.a. Business SummaryIn 2005, a tot
- Page 141 and 142: 7.b. Service BusinessesAs character
- Page 143 and 144: Business categoryNumber ofbusinesse
- Page 145 and 146: 35.034.030.025.0% "Other" businesse
- Page 148 and 149: Chapter 8: Public and Community Dev
- Page 150 and 151: urban areas, cities, and industrial
- Page 152 and 153: Public bus transportationPublic bus
- Page 154 and 155: Ch. 8: Public & community services
- Page 156 and 157: Ch. 8: Public & community services
- Page 158 and 159: VolumeTotal annual vessel calls 395
- Page 160 and 161: Grades 4 - 6Grades 7 - 8Elbert Palm
- Page 162 and 163: Institutions of higher learningAs d
- Page 164 and 165: City of Wilmington government offic
- Page 166 and 167: Hospital Location # of bedsAlfred I
- Page 168 and 169: Ch. 8: Public & community services
- Page 170 and 171: Ch. 8: Public & community services
- Page 172: Chapter 9: Crime, voting, and vital
- Page 175 and 176: 9.a. Crime StatisticsThis section p
- Page 177 and 178:
% Local arrests45.040.035.030.025.0
- Page 179 and 180:
35.0ArrestsComplaints33.330.027.8%
- Page 181 and 182:
Number of votersPartyregisteredTota
- Page 183 and 184:
Figure 9.9. Delaware House of Repre
- Page 185 and 186:
9.c. Vital StatisticsThis section p
- Page 187 and 188:
100.090.090.6Census Tract 19City of
- Page 189 and 190:
City of WilmingtonNew Castle County
- Page 191 and 192:
PropertyclassNumber Building assess
- Page 193 and 194:
Clark, S.L. and Weismantle, M. (200
- Page 195 and 196:
Simmons, T. & O’Neill, G. (2001).
- Page 197 and 198:
City of Wilmington Census tracts:10