South Wilmington Socioeconomic Profile - Delaware Department of ...
South Wilmington Socioeconomic Profile - Delaware Department of ...
South Wilmington Socioeconomic Profile - Delaware Department of ...
- No tags were found...

Create successful ePaper yourself
Turn your PDF publications into a flip-book with our unique Google optimized e-Paper software.
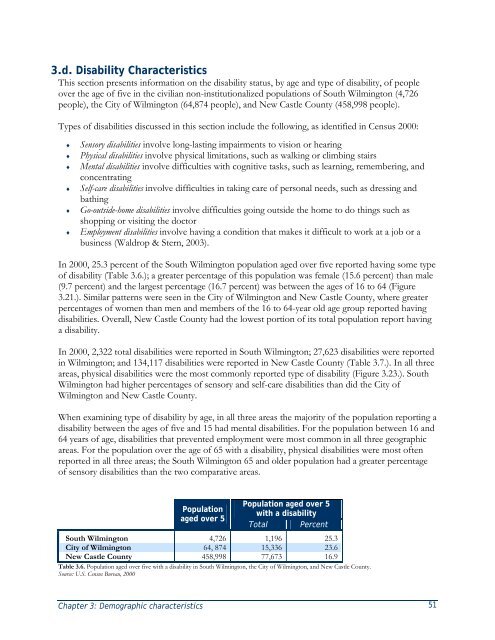
3.d. Disability CharacteristicsThis section presents information on the disability status, by age and type <strong>of</strong> disability, <strong>of</strong> peopleover the age <strong>of</strong> five in the civilian non-institutionalized populations <strong>of</strong> <strong>South</strong> <strong>Wilmington</strong> (4,726people), the City <strong>of</strong> <strong>Wilmington</strong> (64,874 people), and New Castle County (458,998 people).Types <strong>of</strong> disabilities discussed in this section include the following, as identified in Census 2000:♦♦♦♦♦♦Sensory disabilities involve long-lasting impairments to vision or hearingPhysical disabilities involve physical limitations, such as walking or climbing stairsMental disabilities involve difficulties with cognitive tasks, such as learning, remembering, andconcentratingSelf-care disabilities involve difficulties in taking care <strong>of</strong> personal needs, such as dressing andbathingGo-outside-home disabilities involve difficulties going outside the home to do things such asshopping or visiting the doctorEmployment disabilities involve having a condition that makes it difficult to work at a job or abusiness (Waldrop & Stern, 2003).In 2000, 25.3 percent <strong>of</strong> the <strong>South</strong> <strong>Wilmington</strong> population aged over five reported having some type<strong>of</strong> disability (Table 3.6.); a greater percentage <strong>of</strong> this population was female (15.6 percent) than male(9.7 percent) and the largest percentage (16.7 percent) was between the ages <strong>of</strong> 16 to 64 (Figure3.21.). Similar patterns were seen in the City <strong>of</strong> <strong>Wilmington</strong> and New Castle County, where greaterpercentages <strong>of</strong> women than men and members <strong>of</strong> the 16 to 64-year old age group reported havingdisabilities. Overall, New Castle County had the lowest portion <strong>of</strong> its total population report havinga disability.In 2000, 2,322 total disabilities were reported in <strong>South</strong> <strong>Wilmington</strong>; 27,623 disabilities were reportedin <strong>Wilmington</strong>; and 134,117 disabilities were reported in New Castle County (Table 3.7.). In all threeareas, physical disabilities were the most commonly reported type <strong>of</strong> disability (Figure 3.23.). <strong>South</strong><strong>Wilmington</strong> had higher percentages <strong>of</strong> sensory and self-care disabilities than did the City <strong>of</strong><strong>Wilmington</strong> and New Castle County.When examining type <strong>of</strong> disability by age, in all three areas the majority <strong>of</strong> the population reporting adisability between the ages <strong>of</strong> five and 15 had mental disabilities. For the population between 16 and64 years <strong>of</strong> age, disabilities that prevented employment were most common in all three geographicareas. For the population over the age <strong>of</strong> 65 with a disability, physical disabilities were most <strong>of</strong>tenreported in all three areas; the <strong>South</strong> <strong>Wilmington</strong> 65 and older population had a greater percentage<strong>of</strong> sensory disabilities than the two comparative areas.Populationaged over 5Population aged over 5with a disabilityTotal Percent<strong>South</strong> <strong>Wilmington</strong> 4,726 1,196 25.3City <strong>of</strong> <strong>Wilmington</strong> 64, 874 15,336 23.6New Castle County 458,998 77,673 16.9Table 3.6. Population aged over five with a disability in <strong>South</strong> <strong>Wilmington</strong>, the City <strong>of</strong> <strong>Wilmington</strong>, and New Castle County.Source: U.S. Census Bureau, 2000Chapter 3: Demographic characteristics 51