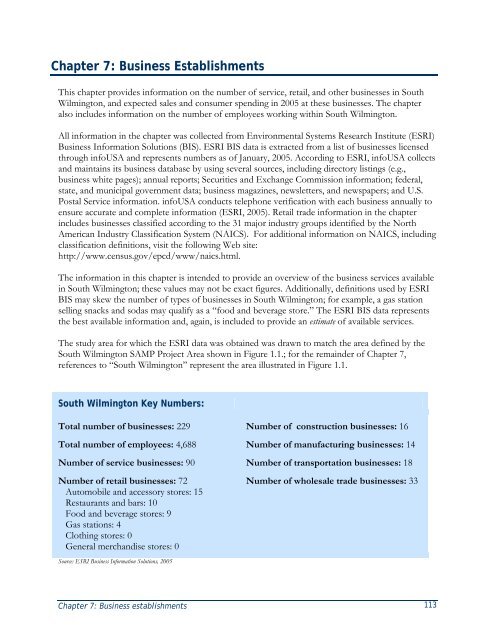
Chapter 7: Business EstablishmentsThis chapter provides information on the number <strong>of</strong> service, retail, and other businesses in <strong>South</strong><strong>Wilmington</strong>, and expected sales and consumer spending in 2005 at these businesses. The chapteralso includes information on the number <strong>of</strong> employees working within <strong>South</strong> <strong>Wilmington</strong>.All information in the chapter was collected from Environmental Systems Research Institute (ESRI)Business Information Solutions (BIS). ESRI BIS data is extracted from a list <strong>of</strong> businesses licensedthrough infoUSA and represents numbers as <strong>of</strong> January, 2005. According to ESRI, infoUSA collectsand maintains its business database by using several sources, including directory listings (e.g.,business white pages); annual reports; Securities and Exchange Commission information; federal,state, and municipal government data; business magazines, newsletters, and newspapers; and U.S.Postal Service information. infoUSA conducts telephone verification with each business annually toensure accurate and complete information (ESRI, 2005). Retail trade information in the chapterincludes businesses classified according to the 31 major industry groups identified by the NorthAmerican Industry Classification System (NAICS). For additional information on NAICS, includingclassification definitions, visit the following Web site:http://www.census.gov/epcd/www/naics.html.The information in this chapter is intended to provide an overview <strong>of</strong> the business services availablein <strong>South</strong> <strong>Wilmington</strong>; these values may not be exact figures. Additionally, definitions used by ESRIBIS may skew the number <strong>of</strong> types <strong>of</strong> businesses in <strong>South</strong> <strong>Wilmington</strong>; for example, a gas stationselling snacks and sodas may qualify as a “food and beverage store.” The ESRI BIS data representsthe best available information and, again, is included to provide an estimate <strong>of</strong> available services.The study area for which the ESRI data was obtained was drawn to match the area defined by the<strong>South</strong> <strong>Wilmington</strong> SAMP Project Area shown in Figure 1.1.; for the remainder <strong>of</strong> Chapter 7,references to “<strong>South</strong> <strong>Wilmington</strong>” represent the area illustrated in Figure 1.1.<strong>South</strong> <strong>Wilmington</strong> Key Numbers:Total number <strong>of</strong> businesses: 229Total number <strong>of</strong> employees: 4,688Number <strong>of</strong> service businesses: 90Number <strong>of</strong> retail businesses: 72Automobile and accessory stores: 15Restaurants and bars: 10Food and beverage stores: 9Gas stations: 4Clothing stores: 0General merchandise stores: 0Source: ESRI Business Information Solutions, 2005Number <strong>of</strong> construction businesses: 16Number <strong>of</strong> manufacturing businesses: 14Number <strong>of</strong> transportation businesses: 18Number <strong>of</strong> wholesale trade businesses: 33Chapter 7: Business establishments 113
7.a. Business SummaryIn 2005, a total <strong>of</strong> 229 businesses were located in <strong>South</strong> <strong>Wilmington</strong>; these businesses employed atotal <strong>of</strong> 4,688 people (Table 7.1.).As shown in Table 7.1., 56 businesses in <strong>South</strong> <strong>Wilmington</strong> fell into the “other services” category,meaning that businesses providing “other services” represented the largest percentage <strong>of</strong> <strong>South</strong><strong>Wilmington</strong> businesses (Figure 7.1.). “Other services” includes personal, business, miscellaneousrepair, and social services, as well as museums; art galleries; membership organizations; engineering,accounting, research, management, and related services; and services not classified elsewhere.The next largest percentage <strong>of</strong> <strong>South</strong> <strong>Wilmington</strong> businesses were involved in wholesale trade,followed by establishments providing automotive services. In 2005, there were no generalmerchandise stores, apparel and accessory stores, securities brokers, insurance carriers, or legalservice providers in <strong>South</strong> <strong>Wilmington</strong>.A total <strong>of</strong> 2,054 people, or 43.8 percent <strong>of</strong> all people working in <strong>South</strong> <strong>Wilmington</strong> in 2005, weregovernment employees (Figure 7.2.). The next category <strong>of</strong> businesses in <strong>South</strong> <strong>Wilmington</strong>employing the most people was wholesale trade, followed by manufacturing and constructioncompanies. The business categories employing the fewest number <strong>of</strong> people were furniture andhome furnishing retailers, hotels, and banks.Business categoryNumber <strong>of</strong> Number <strong>of</strong>businesses employeesAgriculture and mining 6 68Construction 16 309Manufacturing 14 390Transportation 18 178Communication 1 0Electric, gas, water, and sanitary services 3 91Wholesale trade 33 463Home improvement 5 92Food stores 4 36Auto dealers, gas stations, and auto aftermarkets 14 75Furniture and home furnishings 1 12Eating and drinking places 14 104Miscellaneous retail 4 33Banks, savings, and lending institutions 1 11Real estate, holding, or other investment <strong>of</strong>fices 5 30Hotels and lodging 1 9Automotive services 20 117Motion pictures and amusements 3 104Health services 3 204Education institutions and libraries 1 45Other services 56 261Government 6 2,054Other 1 2Total 229 4,688Table 7.1. Number <strong>of</strong> businesses and employees for each business category in <strong>South</strong> <strong>Wilmington</strong>.Source: ESRI Business Information Solutions, 2005114<strong>South</strong> <strong>Wilmington</strong> <strong>Socioeconomic</strong> <strong>Pr<strong>of</strong>ile</strong>
- Page 4 and 5:
Copies of this report may be obtain
- Page 7 and 8:
Socioeconomic information can provi
- Page 10 and 11:
South Wilmington Census block group
- Page 12 and 13:
South Wilmington Census blocks stud
- Page 15:
Table of FiguresFigure 1.1. South W
- Page 19 and 20:
Figure 5.3. Percentages of owner- a
- Page 21 and 22:
Figure 9.1. South Wilmington police
- Page 23 and 24:
Table 4.3. Percent of populations i
- Page 25 and 26:
PrefaceThis socioeconomic profile r
- Page 28 and 29:
Chapter 1: IntroductionThis chapter
- Page 30 and 31:
The South Wilmington SAMP provides
- Page 32 and 33:
Figure 1.2. Illustration of Census
- Page 34 and 35:
South Wilmington Socioeconomic Prof
- Page 36 and 37:
Other dataThroughout this report, d
- Page 38 and 39:
The Christina River watershed also
- Page 40 and 41:
Chapter 8: Public and community dev
- Page 42:
Chapter 2: Demographic and Housing
- Page 45 and 46:
DRAFT: Not for distributionFigure 2
- Page 47 and 48:
DRAFT: Not for distributionIn 2000,
- Page 49:
DRAFT: Not for distributiona. Males
- Page 52 and 53:
South Wilmington City of Wilmington
- Page 54 and 55:
% Local family households80.070.060
- Page 56:
Chapter 3: Demographic Characterist
- Page 59 and 60:
Figure 3.1. The four Census block g
- Page 61 and 62:
Gender distributionIn South Wilming
- Page 63 and 64:
a. Males by age% Local female popul
- Page 65 and 66:
a. Males% Local male population age
- Page 67 and 68:
a. South Wilmington80.070.0MalesFem
- Page 69 and 70:
Household typesThe Census Bureau de
- Page 71 and 72:
45.040.0a. Family households39.737.
- Page 73 and 74:
60.056.954.752.5South WilmingtonCit
- Page 75 and 76:
100.090.094.2 94.1 93.4South Wilmin
- Page 77 and 78:
% Local population aged 5 years and
- Page 79 and 80:
a. Population aged 5-15 years% Disa
- Page 82 and 83:
Chapter 4: Employment and Residenti
- Page 84 and 85:
Overall, the majority of the popula
- Page 86 and 87: South WilmingtonCity of WilmingtonN
- Page 88 and 89: % Local employed population18.016.0
- Page 90 and 91: Journey to workThis section present
- Page 92 and 93: % Local workers aged 16 years and o
- Page 94 and 95: 80.070.072.267.866.5South Wilmingto
- Page 96 and 97: 4.b. Residential Income Characteris
- Page 98 and 99: The U.S. Census Bureau defines soci
- Page 100 and 101: 100.090.0South WilmingtonCity of Wi
- Page 102 and 103: a. Residents with incomes below the
- Page 104 and 105: a. Family households100.090.0South
- Page 106: Chapter 5: Residential DevelopmentC
- Page 109 and 110: Figure 5.1. The four Census block g
- Page 111 and 112: Renter versus owner occupancyRenter
- Page 113 and 114: a. Housing units with mortgages60.0
- Page 115 and 116: a. Owner-occupied housing units70.0
- Page 117 and 118: 5.d. Age of Housing UnitsIn 2000, m
- Page 119 and 120: a. Owner-occupied housing units35.0
- Page 121 and 122: 5.f. Housing Unit Facilities and Ut
- Page 123 and 124: Telephone service availability inre
- Page 125 and 126: a. Owner-occupied housing units45.0
- Page 128 and 129: Chapter 6: Land UseThis chapter pro
- Page 130 and 131: In 2002, under the Anderson Classif
- Page 132 and 133: Anderson Classification Area (acres
- Page 134 and 135: Chapter 6: Land use 109Figure 6.4.
- Page 136: Chapter 7: Business establishments
- Page 141 and 142: 7.b. Service BusinessesAs character
- Page 143 and 144: Business categoryNumber ofbusinesse
- Page 145 and 146: 35.034.030.025.0% "Other" businesse
- Page 148 and 149: Chapter 8: Public and Community Dev
- Page 150 and 151: urban areas, cities, and industrial
- Page 152 and 153: Public bus transportationPublic bus
- Page 154 and 155: Ch. 8: Public & community services
- Page 156 and 157: Ch. 8: Public & community services
- Page 158 and 159: VolumeTotal annual vessel calls 395
- Page 160 and 161: Grades 4 - 6Grades 7 - 8Elbert Palm
- Page 162 and 163: Institutions of higher learningAs d
- Page 164 and 165: City of Wilmington government offic
- Page 166 and 167: Hospital Location # of bedsAlfred I
- Page 168 and 169: Ch. 8: Public & community services
- Page 170 and 171: Ch. 8: Public & community services
- Page 172: Chapter 9: Crime, voting, and vital
- Page 175 and 176: 9.a. Crime StatisticsThis section p
- Page 177 and 178: % Local arrests45.040.035.030.025.0
- Page 179 and 180: 35.0ArrestsComplaints33.330.027.8%
- Page 181 and 182: Number of votersPartyregisteredTota
- Page 183 and 184: Figure 9.9. Delaware House of Repre
- Page 185 and 186: 9.c. Vital StatisticsThis section p
- Page 187 and 188:
100.090.090.6Census Tract 19City of
- Page 189 and 190:
City of WilmingtonNew Castle County
- Page 191 and 192:
PropertyclassNumber Building assess
- Page 193 and 194:
Clark, S.L. and Weismantle, M. (200
- Page 195 and 196:
Simmons, T. & O’Neill, G. (2001).
- Page 197 and 198:
City of Wilmington Census tracts:10