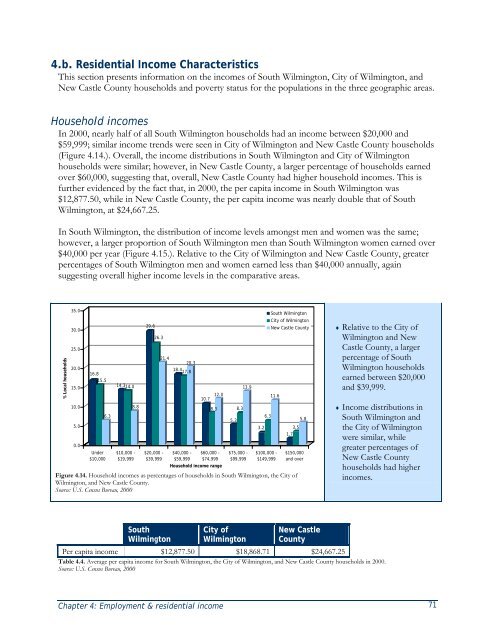
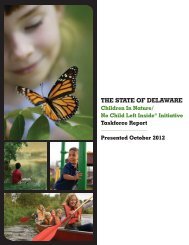
4.b. Residential Income CharacteristicsThis section presents information on the incomes <strong>of</strong> <strong>South</strong> <strong>Wilmington</strong>, City <strong>of</strong> <strong>Wilmington</strong>, andNew Castle County households and poverty status for the populations in the three geographic areas.Household incomesIn 2000, nearly half <strong>of</strong> all <strong>South</strong> <strong>Wilmington</strong> households had an income between $20,000 and$59,999; similar income trends were seen in City <strong>of</strong> <strong>Wilmington</strong> and New Castle County households(Figure 4.14.). Overall, the income distributions in <strong>South</strong> <strong>Wilmington</strong> and City <strong>of</strong> <strong>Wilmington</strong>households were similar; however, in New Castle County, a larger percentage <strong>of</strong> households earnedover $60,000, suggesting that, overall, New Castle County had higher household incomes. This isfurther evidenced by the fact that, in 2000, the per capita income in <strong>South</strong> <strong>Wilmington</strong> was$12,877.50, while in New Castle County, the per capita income was nearly double that <strong>of</strong> <strong>South</strong><strong>Wilmington</strong>, at $24,667.25.In <strong>South</strong> <strong>Wilmington</strong>, the distribution <strong>of</strong> income levels amongst men and women was the same;however, a larger proportion <strong>of</strong> <strong>South</strong> <strong>Wilmington</strong> men than <strong>South</strong> <strong>Wilmington</strong> women earned over$40,000 per year (Figure 4.15.). Relative to the City <strong>of</strong> <strong>Wilmington</strong> and New Castle County, greaterpercentages <strong>of</strong> <strong>South</strong> <strong>Wilmington</strong> men and women earned less than $40,000 annually, againsuggesting overall higher income levels in the comparative areas.% Local households35.030.025.020.015.010.05.00.016.815.5Under$10,0006.314.3 14.08.8$10,000 -$19,99929.626.3$20,000 -$39,99921.420.318.4 17.8$40,000 -$59,99912.010.78.3$60,000 -$74,999Household income range5.38.313.9$75,000 -$99,9993.26.311.6$100,000 -$149,999<strong>South</strong> <strong>Wilmington</strong>City <strong>of</strong> <strong>Wilmington</strong>New Castle County3.51.75.8$150,000and overFigure 4.14. Household incomes as percentages <strong>of</strong> households in <strong>South</strong> <strong>Wilmington</strong>, the City <strong>of</strong><strong>Wilmington</strong>, and New Castle County.Source: U.S. Census Bureau, 2000♦ Relative to the City <strong>of</strong><strong>Wilmington</strong> and NewCastle County, a largerpercentage <strong>of</strong> <strong>South</strong><strong>Wilmington</strong> householdsearned between $20,000and $39,999.♦ Income distributions in<strong>South</strong> <strong>Wilmington</strong> andthe City <strong>of</strong> <strong>Wilmington</strong>were similar, whilegreater percentages <strong>of</strong>New Castle Countyhouseholds had higherincomes.<strong>South</strong><strong>Wilmington</strong>City <strong>of</strong><strong>Wilmington</strong>New CastleCountyPer capita income $12,877.50 $18,868.71 $24,667.25Table 4.4. Average per capita income for <strong>South</strong> <strong>Wilmington</strong>, the City <strong>of</strong> <strong>Wilmington</strong>, and New Castle County households in 2000.Source: U.S. Census Bureau, 2000Chapter 4: Employment & residential income 71
a. Males45.040.035.6<strong>South</strong> <strong>Wilmington</strong>City <strong>of</strong> <strong>Wilmington</strong>New Castle County% Local male population with earnings35.030.025.020.015.010.021.4 20.615.525.617.212.032.729.215.018.824.86.611.57.0% Local female population with earnings5.00.045.040.035.030.025.020.015.010.0Under $10,000 $10,000 -$19,999b. Females28.023.3 23.7 21.2 22.2 17.8$20,000 -$39,99942.8Income range35.5 36.4 7.1$40,000 -$64,99913.216.51.1$65,000 -$99,9991.34.0Over $100,000<strong>South</strong> <strong>Wilmington</strong>City <strong>of</strong> <strong>Wilmington</strong>New Castle County♦ Relative to the City <strong>of</strong><strong>Wilmington</strong> and NewCastle County, <strong>South</strong><strong>Wilmington</strong> men andwomen had lowerincomes.♦ In all three areas, menoverall had higherincomes than women.5.00.0Under $10,000 $10,000 -$19,999$20,000 -$39,999Income range$40,000 -$64,9990.63.8 4.0$65,000 -$99,9990.3 2.0 1.5Over $100,000Figure 4.15. Income levels for males (top) and females (bottom) in <strong>South</strong> <strong>Wilmington</strong>, the City <strong>of</strong><strong>Wilmington</strong>, and New Castle County.Source: U.S. Census Bureau, 2000Retirement and social security incomeRetirement income includes payments received from: companies or unions; the federal government;the military; state or local governments; railroad retirement; annuities or paid-up insurance policies;individual retirement accounts (IRAs) or 401(k) payments; or other retirement income. In <strong>South</strong><strong>Wilmington</strong>, 22.3 percent <strong>of</strong> households were receiving some type <strong>of</strong> retirement income, versus 17.4percent <strong>of</strong> City <strong>of</strong> <strong>Wilmington</strong> households and 18.9 percent <strong>of</strong> New Castle County households(Figure 4.16.). The majority <strong>of</strong> households in all three areas had no retirement income as <strong>of</strong> 2000.72<strong>South</strong> <strong>Wilmington</strong> <strong>Socioeconomic</strong> <strong>Pr<strong>of</strong>ile</strong>
- Page 4 and 5:
Copies of this report may be obtain
- Page 7 and 8:
Socioeconomic information can provi
- Page 10 and 11:
South Wilmington Census block group
- Page 12 and 13:
South Wilmington Census blocks stud
- Page 15:
Table of FiguresFigure 1.1. South W
- Page 19 and 20:
Figure 5.3. Percentages of owner- a
- Page 21 and 22:
Figure 9.1. South Wilmington police
- Page 23 and 24:
Table 4.3. Percent of populations i
- Page 25 and 26:
PrefaceThis socioeconomic profile r
- Page 28 and 29:
Chapter 1: IntroductionThis chapter
- Page 30 and 31:
The South Wilmington SAMP provides
- Page 32 and 33:
Figure 1.2. Illustration of Census
- Page 34 and 35:
South Wilmington Socioeconomic Prof
- Page 36 and 37:
Other dataThroughout this report, d
- Page 38 and 39:
The Christina River watershed also
- Page 40 and 41:
Chapter 8: Public and community dev
- Page 42:
Chapter 2: Demographic and Housing
- Page 45 and 46: DRAFT: Not for distributionFigure 2
- Page 47 and 48: DRAFT: Not for distributionIn 2000,
- Page 49: DRAFT: Not for distributiona. Males
- Page 52 and 53: South Wilmington City of Wilmington
- Page 54 and 55: % Local family households80.070.060
- Page 56: Chapter 3: Demographic Characterist
- Page 59 and 60: Figure 3.1. The four Census block g
- Page 61 and 62: Gender distributionIn South Wilming
- Page 63 and 64: a. Males by age% Local female popul
- Page 65 and 66: a. Males% Local male population age
- Page 67 and 68: a. South Wilmington80.070.0MalesFem
- Page 69 and 70: Household typesThe Census Bureau de
- Page 71 and 72: 45.040.0a. Family households39.737.
- Page 73 and 74: 60.056.954.752.5South WilmingtonCit
- Page 75 and 76: 100.090.094.2 94.1 93.4South Wilmin
- Page 77 and 78: % Local population aged 5 years and
- Page 79 and 80: a. Population aged 5-15 years% Disa
- Page 82 and 83: Chapter 4: Employment and Residenti
- Page 84 and 85: Overall, the majority of the popula
- Page 86 and 87: South WilmingtonCity of WilmingtonN
- Page 88 and 89: % Local employed population18.016.0
- Page 90 and 91: Journey to workThis section present
- Page 92 and 93: % Local workers aged 16 years and o
- Page 94 and 95: 80.070.072.267.866.5South Wilmingto
- Page 98 and 99: The U.S. Census Bureau defines soci
- Page 100 and 101: 100.090.0South WilmingtonCity of Wi
- Page 102 and 103: a. Residents with incomes below the
- Page 104 and 105: a. Family households100.090.0South
- Page 106: Chapter 5: Residential DevelopmentC
- Page 109 and 110: Figure 5.1. The four Census block g
- Page 111 and 112: Renter versus owner occupancyRenter
- Page 113 and 114: a. Housing units with mortgages60.0
- Page 115 and 116: a. Owner-occupied housing units70.0
- Page 117 and 118: 5.d. Age of Housing UnitsIn 2000, m
- Page 119 and 120: a. Owner-occupied housing units35.0
- Page 121 and 122: 5.f. Housing Unit Facilities and Ut
- Page 123 and 124: Telephone service availability inre
- Page 125 and 126: a. Owner-occupied housing units45.0
- Page 128 and 129: Chapter 6: Land UseThis chapter pro
- Page 130 and 131: In 2002, under the Anderson Classif
- Page 132 and 133: Anderson Classification Area (acres
- Page 134 and 135: Chapter 6: Land use 109Figure 6.4.
- Page 136: Chapter 7: Business establishments
- Page 139 and 140: 7.a. Business SummaryIn 2005, a tot
- Page 141 and 142: 7.b. Service BusinessesAs character
- Page 143 and 144: Business categoryNumber ofbusinesse
- Page 145 and 146: 35.034.030.025.0% "Other" businesse
- Page 148 and 149:
Chapter 8: Public and Community Dev
- Page 150 and 151:
urban areas, cities, and industrial
- Page 152 and 153:
Public bus transportationPublic bus
- Page 154 and 155:
Ch. 8: Public & community services
- Page 156 and 157:
Ch. 8: Public & community services
- Page 158 and 159:
VolumeTotal annual vessel calls 395
- Page 160 and 161:
Grades 4 - 6Grades 7 - 8Elbert Palm
- Page 162 and 163:
Institutions of higher learningAs d
- Page 164 and 165:
City of Wilmington government offic
- Page 166 and 167:
Hospital Location # of bedsAlfred I
- Page 168 and 169:
Ch. 8: Public & community services
- Page 170 and 171:
Ch. 8: Public & community services
- Page 172:
Chapter 9: Crime, voting, and vital
- Page 175 and 176:
9.a. Crime StatisticsThis section p
- Page 177 and 178:
% Local arrests45.040.035.030.025.0
- Page 179 and 180:
35.0ArrestsComplaints33.330.027.8%
- Page 181 and 182:
Number of votersPartyregisteredTota
- Page 183 and 184:
Figure 9.9. Delaware House of Repre
- Page 185 and 186:
9.c. Vital StatisticsThis section p
- Page 187 and 188:
100.090.090.6Census Tract 19City of
- Page 189 and 190:
City of WilmingtonNew Castle County
- Page 191 and 192:
PropertyclassNumber Building assess
- Page 193 and 194:
Clark, S.L. and Weismantle, M. (200
- Page 195 and 196:
Simmons, T. & O’Neill, G. (2001).
- Page 197 and 198:
City of Wilmington Census tracts:10