Manfred Breithaupt
Manfred Breithaupt
Manfred Breithaupt

Create successful ePaper yourself
Turn your PDF publications into a flip-book with our unique Google optimized e-Paper software.
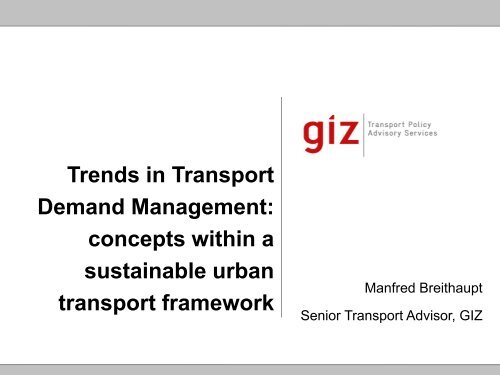
Trends in Transport<br />
Demand Management:<br />
concepts within a<br />
sustainable urban<br />
transport framework<br />
<strong>Manfred</strong> <strong>Breithaupt</strong><br />
Senior Transport Advisor, GIZ
� Liveable Cities & Urban Life<br />
What means Liveable?<br />
�A liveable city is a city that provides a high quality of life<br />
for its citizens<br />
�This requires:Economic strength,Social balance,Ecological viability<br />
�All these elements are interdependent<br />
London Brussels 18.05.2011<br />
Vienna
What influences Liveability?<br />
Direct transport related factors:<br />
� Infrastructure<br />
� Accessibility<br />
� Quality of architecture<br />
� Urban design<br />
� Public Transportation<br />
� Public places<br />
� ...etc.<br />
� Liveable Cities & Urban Life<br />
Other factors:<br />
�Safety/Crime<br />
�Schools and education<br />
�Recreation<br />
�Political stability<br />
�Availability of<br />
goods/services<br />
�Economic/Business<br />
conditions 18.05.2011
� Liveable Cities & Urban Life<br />
� In a survey conducted among companies of the services sector in<br />
London access to public transport was ranked the most<br />
important location factor.<br />
18.05.2011<br />
Source: CB Richard Ellis, 2008.
Liveable Cities & Urban Life<br />
Rankings of Quality of Living (1)<br />
Mercer Quality of Living Survey 2010 – Top 10 (worldwide):<br />
� Vienna, Austria (1st)<br />
� Zurich, Switzerland (2nd)<br />
� Geneva, Switzerland (3rd )<br />
� Vancouver, Canada (tied 4th)<br />
� Auckland, New Zealand (tied 4th)<br />
Source: VBZ Zurich, 2009, http://vbz.ch.<br />
� Düsseldorf, Germany (6th)<br />
� Frankfurt, Germany (7th)<br />
� Munich, Germany (7th)<br />
� Bern, Switzerland (9th)<br />
� Sydney, Australia (10th)<br />
18.05.2011<br />
Vienna Zurich Munich
Trends in cities<br />
� Rapidly increasing car<br />
ownership and use<br />
� Failures in Urban and Transport Planning<br />
� Declining mode share of public<br />
transport, walking, and cycling<br />
� Declining city centres; rapid<br />
decentralisation into caroriented<br />
suburban sprawl<br />
Focus was given to road<br />
design:<br />
� More infrastructure<br />
for cars<br />
� More space for<br />
motorized vehicles<br />
� Unsustainable focus<br />
Source: Xie/GTZ 2006, Beijing<br />
18.05.2011
Traffic growth outpaces<br />
population and job growth…<br />
but expanding roads yields no long-term<br />
relief because it induces more traffic
Relationship between GDP per Capita and<br />
Individual Motorised Modal Share<br />
Decoupling of economic growth and individual motorised<br />
transport achievable!<br />
Source: IEA, Energy Technology Perspectives, Paris 2008
The challenges in urban transport and<br />
TDM<br />
• Urban areas require<br />
proper road networks<br />
• New roads attract more<br />
traffic and reduce the<br />
viability of public<br />
transport<br />
• Transport benefits will<br />
be offset by future<br />
congestion<br />
Transport Demand Management shall<br />
• reduce the total volume of traffic<br />
• promote shifts towards more<br />
sustainable modes of transport<br />
with the objectives to<br />
• reduce traffic congestion<br />
• reduce adverse effects on the<br />
environment or public health<br />
• generate additional revenue to<br />
improve public transport and NMT<br />
by pricing mechanisms
We Can’t Build Our Way Out of<br />
Congestion<br />
Transportation systems worldwide are undergoing a shift<br />
from supply side techniques to demand management<br />
New<br />
highways<br />
Public<br />
transport<br />
improvements<br />
Supply side Demand side<br />
Toll roads<br />
Adding<br />
lanes<br />
HOV<br />
lanes<br />
HOT<br />
lanes<br />
Adapted from Derek Turner Consulting<br />
Area<br />
license or<br />
fee<br />
Cordon<br />
tolls<br />
Public transport<br />
priority<br />
Parking<br />
control<br />
Congestion<br />
charges<br />
Taxation<br />
policy
Transport Demand Management<br />
measures<br />
Transport demand management measures (including fiscal policies)<br />
� Land use development controls<br />
� Public transport integration<br />
� Parking controls and management<br />
� Regulatory controls such as odd/even systems<br />
� Physical measures such as bus and pedestrian priority<br />
� Pricing & charges through fuels, annual taxes<br />
� Congestion charging<br />
TDM policies cannot be implemented as isolated<br />
instruments, but – for being successful – have always to<br />
be embedded in a comprehensive framework of<br />
Transport Demand Management measures.
Examples of TDM measures:
Examples of TDM travel impacts<br />
GIZ, 2009
TDM as part of a<br />
sustainable transport system<br />
GIZ, 2009
TDM - Checklist<br />
Planning<br />
Instruments<br />
Regulatory<br />
Instruments<br />
Economic<br />
Instruments<br />
Information<br />
Instruments<br />
Integration of Land Use and<br />
Transport Planning<br />
e.g. Transit-oriented<br />
developement<br />
Public Transport Promotion e.g. Priority at Intersections<br />
Strategies for Non-Motorised Modes e.g. Cycling Policy<br />
Physical Restraint Measures e.g. Pedestrian zones<br />
Traffic Management Measures ITS<br />
Regulation of Parking Supply Maximum parking limits<br />
Low Emission Zone In City Center<br />
Speed Restrictions (30 km/h) In built up areas<br />
Road Pricing e.g. during peak hours<br />
Tax Incentives e.g. for cleaner vehicles<br />
Parking Pricing Off- and on-street parking<br />
Public Awareness Campaigns E.g. participation in Mobility<br />
Weeks<br />
Stakeholder Conferences On transport policy documents<br />
Driver Training / Eco Driving e.g. for City drivers<br />
Promotion of Mobility Management<br />
in Companies<br />
e.g. Employer Passes, flexible<br />
work hours<br />
Technology Promotion of Cleaner Technology e.g. Green Procurement<br />
Good<br />
example<br />
s score<br />
more<br />
than 10<br />
out of<br />
the 16<br />
criteria
The push and pull approach<br />
Source: Müller, P., Schleicher-Jester, F., Schmidt, M.-P. & Topp, H.H. (1992): Konzepte flächenhafter Verkehrsberuhigung<br />
in 16 Städten”, Grüne Reihe des Fachgebiets Verkehrswesen der Universität Kaiserslautern No. 24.
Land use development controls:<br />
Modal split in various European cities<br />
100%<br />
90%<br />
80%<br />
70%<br />
60%<br />
50%<br />
40%<br />
30%<br />
20%<br />
10%<br />
0%<br />
28%<br />
7%<br />
37%<br />
28%<br />
Zürich<br />
1992<br />
22% 22%<br />
32%<br />
10%<br />
18%<br />
21%<br />
30%<br />
6%<br />
22%<br />
13%<br />
26%<br />
25% 24% 21%<br />
10% 17%<br />
16%<br />
21%<br />
37% 39% 39% 41% 43% 44% 45%<br />
Münster<br />
1994<br />
Freiburg<br />
1998<br />
Frankfurt<br />
1998<br />
München<br />
1997<br />
Dresden<br />
1998<br />
23% 22% 22% 23%<br />
Karlsruhe<br />
1992<br />
car public transport bicycle foot<br />
Major shifts in the modal split<br />
12% 11% 10%<br />
Hamburg<br />
1991<br />
15%<br />
52%<br />
Urban<br />
Areas<br />
1997<br />
11%<br />
56%<br />
West<br />
Germany<br />
1997<br />
Münster<br />
54% of all trips are<br />
by non-motorized<br />
means of transport<br />
(walking, bicycle).<br />
Zurich<br />
private car use is<br />
smaller than 30%<br />
whereas public<br />
transport covers<br />
nearly 40% of all<br />
trips.<br />
Major shifts in the modal split proved possible (e.g. in Zurich, Freiburg, Münster) when<br />
the local authorities implemented a comprehensive and integrated urban policy.
Why Zurich is so successful?<br />
Context<br />
Two major projects for<br />
underground<br />
transportation systems<br />
were rejected by voters<br />
in referendums in 1962<br />
and 1973<br />
The town council saw<br />
this as a mandate to<br />
continue working with<br />
the existing transport<br />
system based on trams<br />
and buses and to<br />
develop these into a<br />
modern, efficient and<br />
attractive transport<br />
system<br />
Reasons for the success of<br />
today’s public transport<br />
Visible predominance in the streets<br />
• Frequent bus and tram circulation<br />
High quality of services<br />
• Comprehensive network<br />
• High frequency<br />
• Clear timetables at each stop<br />
Telematics system<br />
• Priority for buses and trams at intersections<br />
Integrated Networks and Timetables<br />
• Complete integration of the suburban railway<br />
lines into the city„s network<br />
• Integrated fare system, coordinated timetables<br />
Investment and operating costs<br />
• In comparison to underground transportation<br />
investment costs are only a fraction<br />
(e.g. the whole telematics system costs only as<br />
much as half a kilometer of a metro tunnel)
Source: Internationales Verkehrswesen, 100 Jahre<br />
DVWG, p. 17<br />
� International Experiences<br />
Examples: Berlin – Shared Space in Berlin 1908<br />
Unter den Linden/ Friedrichsstraße:<br />
The street belonged to everyone:<br />
automobiles, buses, carriages,<br />
pedestrians<br />
In this era, people were enthusiastic<br />
about technology and the<br />
achievements of modernity; while at<br />
the same time they felt anxious<br />
about the rapid and radical changes<br />
in their social and economic life. In<br />
Germany, this contradictory<br />
experience was especially harsh<br />
and perceptible in the urban<br />
metropolis of Berlin.
Singapore in the 70’s…before<br />
congestion charging<br />
Source: LTA
Singapore today…<br />
after 30 years of road pricing and<br />
public transport investment<br />
CBD and<br />
motorway toll<br />
rates adjusted<br />
4x/year to keep<br />
traffic speeds<br />
at peak system<br />
performance
Case Study: Beijing<br />
Travel Demand Management<br />
Through odd and even License plate number policy<br />
During Olympic road traffic reduced by 23%<br />
Traffic volume before and in Game time on west 3rd. Ring road in morning peak hour<br />
Source: Dr. Guo Jifu
Source: Dr. Guo Jifu<br />
Case Study: Beijing<br />
Vehicle Growth
Source: Dr. Guo Jifu<br />
Case Study: Beijing<br />
Modal Split Change
10<br />
8<br />
6<br />
4<br />
2<br />
0<br />
Case Study: Beijing<br />
Traffic Congestion Index<br />
月平均交通拥堵指数变化(工作日)<br />
2007年 2008年 2009年<br />
1月 2月 3月 4月 5月 6月 7月 8月 9月 10月 11月 12月<br />
Heavy<br />
Congestion<br />
Source: Dr. Guo Jifu<br />
Moderate<br />
Congestion<br />
Light<br />
Congestion<br />
Smooth<br />
Traffic<br />
Free<br />
Flow
Daily<br />
Mileage(km)<br />
Source: Dr. Guo Jifu<br />
Case Study: Beijing<br />
Challenges<br />
Car Usage<br />
City Parking fee<br />
(Rmb/H)<br />
NY 70<br />
Tokyo 40<br />
Hong Kong 8-40<br />
Beijing 10<br />
Shanghai 10-20<br />
Jakarta 2-3<br />
Tokyo LA HK London Beijing<br />
14 43 39 30 45
Case Study: Beijing<br />
The new policy in Beijing<br />
�Make Public Transport the first choice<br />
�Rethink role of NMT<br />
�Travel Demand Management is<br />
extremely important<br />
�Green Transport<br />
Source: Dr. Guo Jifu
The three basic routes to improve energy efficiency<br />
REDUCE<br />
Reduce or avoid travel<br />
or the need to travel<br />
• Integration of transport<br />
and land-use planning<br />
• Smart logistics<br />
concepts<br />
• …<br />
SHIFT<br />
Shift to more environmentally<br />
friendly modes<br />
• Transport Demand<br />
Management<br />
• Mode shift to Non-<br />
Motorized Transport<br />
• Mode shift to Public<br />
Transport<br />
• …<br />
IMPROVE<br />
Improve the energy<br />
efficiency of transport<br />
modes and vehicle<br />
technology<br />
• Low-friction lubricants<br />
• Optimal tire pressure<br />
• Low Rolling Resistance Tires<br />
• Speed limits Eco-Driving<br />
(Raising Awareness)<br />
• Shift to alternative fuels<br />
• …
Starting point:<br />
A household<br />
requires a wide<br />
range of goods,<br />
with varying<br />
frequency.<br />
Traffic generation & Carbon emissions:<br />
What aspects should we concentrate on?<br />
First decision:<br />
How far do you<br />
have to go?<br />
Example: Shopping<br />
Second decision:<br />
Which mode of<br />
transport will you<br />
(have to) use?<br />
10 km<br />
?<br />
2 km<br />
Smart infrastructure<br />
planning: Reduces<br />
need for travelling!<br />
AVOID/REDUCE<br />
Encourage use of<br />
non-motorized and<br />
public transport!<br />
SHIFT<br />
Third decision:<br />
Which type<br />
of vehicle + use?<br />
?<br />
Reduce car<br />
size and<br />
consider using<br />
alternative fuels!<br />
IMPROVE
Source: GIZ, 2011<br />
Modes of Transport & Carbon emissions:<br />
Some modes are greener than others<br />
How far can I travel with 1 ton of CO2?
Induced Traffic:<br />
Build It And They Will Come<br />
From Michael Replogle<br />
�For every 100% increase in<br />
road capacity expect a 30%-<br />
120% increase in traffic (with<br />
80% typical)<br />
�Expanding roads to solve<br />
congestion: like buying bigger<br />
pants to cure obesity<br />
�When road capacity is<br />
removed, much of the traffic<br />
disappears
Copenhagen<br />
bike network<br />
EVERY major<br />
arterial has a bike<br />
lane
MODAL SPLIT:<br />
36% go to work on bicycle<br />
23% use car<br />
33% use public transport<br />
Induced<br />
Bicycle<br />
Traffic<br />
Cycling in<br />
Copenhagen<br />
increased by<br />
100% from<br />
1990 to 2000
Traffic Cells: Making Walk and Bike Access Central<br />
�Direct paths with priority for pedestrians, bikes, public<br />
transport<br />
�4 of 5 internal trips by walk/bike<br />
�Development focus around public transport station<br />
�Examples: Houten, Delft, Gronigen (Neth.); Gottenberg<br />
(Sweden); Davis, California, Bremen (Germany); Japan
Reform Zoning, Street Codes for<br />
Expanded Choices<br />
�Channelize traffic with medians, traffic calming, street design<br />
�Adopt codes for “Complete Streets” so pedestrians and<br />
bicycles are routinely & safely accommodated & encouraged<br />
�Adopt street design codes accommodating Bus Rapid Transit<br />
�Ensure public transport is extended to areas of development
Financial: National Instruments<br />
1. Fuel Taxes and Surcharges<br />
Charges on fuels levied by governments,<br />
sometimes additional fuel surcharges by<br />
provinces of cities<br />
Characteristics:<br />
• Simple, cost-efficient and reliable way of<br />
charging<br />
• Most appropriate way to focus on the<br />
user-pay-principle<br />
• Political acceptability sometimes<br />
problematic, political pressure sometimes<br />
keep fuel prices low<br />
“On a global level between 80 to 90% of<br />
all revenues derived from the transport<br />
sector are being raised from fuel taxes”<br />
Case Study: Fuel surcharge in Colombia<br />
•In all Colombian cities a 20% surcharge to all gasoline sales is levied<br />
•Half of revenues are used for Bogotá‟s TransMilenio System<br />
•Private vehicle owners finance one third of a mass transport system<br />
•72% of passengers belong to low income citizens
Financial: National Instruments<br />
1. Fuel Taxes and Surcharges<br />
Retail Prices of gasoline in US cents per litre, 2008<br />
Figure by GTZ, 2009<br />
“As a rule of<br />
thumb, a level of<br />
revenue equal to<br />
10 -15 US cents<br />
per litre of fuel is<br />
usually adequate<br />
to cover the costs<br />
of maintenance<br />
for the whole road<br />
network of a<br />
country.<br />
Mechanisms must<br />
be placed to<br />
channel such<br />
national-level<br />
resources also to<br />
the local level.”
Financial: National Instruments<br />
2. Vehicle related Taxes and Charges<br />
Tax or charge on car ownership<br />
Characteristics:<br />
• Taxes are very flexible, can be<br />
varied depending on engine size,<br />
carbon emissions, environmental<br />
standards, income, weight or<br />
number of axes<br />
• Taxes are able to reflect<br />
externalities<br />
• Political acceptability may be<br />
problematic<br />
Considerations:<br />
• Liaise with central government to set the optimal tax for the local context<br />
• Differentiate the charge to reflect external costs
Financial: National Instruments<br />
2. Vehicle related Taxes and Charges<br />
EU countries<br />
• 17 of the EU„s 27 member<br />
states meanwhile apply CO 2 –<br />
based car taxation<br />
• 15 countries also offer cash<br />
incentives for buying electric<br />
vehicles
Financial: National Instruments<br />
2. Vehicle related Taxes and Charges<br />
Overview ( Car taxation in France)<br />
Eco Bonus<br />
CO² Emission Rate<br />
(Grams/Km)<br />
Amount<br />
2010 2011 2012<br />
≤60 5 000 5 000 5 000<br />
>60≤90 1 000 1 000 1 000<br />
>90≤95 1 000 1 000 700<br />
>95≤100 700 700 700<br />
>100≤105 700 700 700<br />
>105≤110 700 700 700<br />
>110≤115 700 700 200<br />
>115≤120 200 200 200<br />
>120≤125 200 200 0<br />
>125≤130 0 0 0<br />
Source: http://www.french-property.com/news/money_france/car_emission_tax_bonus/<br />
Eco Penalty<br />
CO² Emission Rate<br />
(Grams/Km)<br />
Tax Amount<br />
2010 2011 2012<br />
≤150 0 0 0<br />
>150≤155 0 200 200<br />
>155≤160 200 750 750<br />
>160≤165 750 750 750<br />
>165≤190 750 750 750<br />
>190≤195 750 1 600 1 600<br />
>195≤200 1 600 1 600 1 600<br />
>200≤240 1 600 1 600 1 600<br />
>240≤245 1 600 2 600 2 600<br />
>245≤250 2 600 2 600 2 600
Financial: Local Instruments<br />
1. Road Pricing/Congestion Charging<br />
Direct charging for using public road<br />
space<br />
Types:<br />
• Cordon pricing<br />
• Time-independent tolling<br />
• Electronic road pricing<br />
Characteristics:<br />
• Directly charges use of scarce public<br />
space<br />
• Flexibility<br />
• Leads to reduction of congestion,<br />
pollution, noise, traffic accidents<br />
• political acceptability often difficult<br />
Photo by Liamond<br />
Photo by Carlos F. Pardo<br />
Considerations:<br />
• Revenues should be used for<br />
public transport improvements to<br />
foster a modal shift and increase<br />
of public and political<br />
acceptability
Financial: Local Instruments<br />
1. Road Pricing/Congestion Charging<br />
Impacts 1 (Congestion Charging in London)<br />
Traffic<br />
20%<br />
(-20,000 veh/day)<br />
37%<br />
(17 km/hr)<br />
Travel<br />
Speed<br />
Congestion<br />
Delay<br />
30%<br />
14%<br />
Bus<br />
Ridership<br />
72%<br />
Bicycle<br />
Use<br />
+<br />
-<br />
1 in the monitoring period after implementation
Financial: Local Instruments<br />
1. Road Pricing/Congestion Charging (II)<br />
Impacts 1 (Congestion Charging in London)<br />
+<br />
Taxi<br />
Travel<br />
Cost<br />
-20-40%<br />
Bus<br />
Congestion<br />
Delay<br />
50%<br />
Air<br />
Pollution<br />
16-19%<br />
4.7%<br />
Retail<br />
Activity<br />
Road<br />
accidents<br />
70 less<br />
per year<br />
1 in the monitoring period after implementation
Financial: Local Instruments<br />
2. Parking Management<br />
�Increased parking supply means more<br />
driving<br />
�Restraining parking supply, boosting<br />
parking cost helps reduce driving<br />
�Limits set on parking supply in many<br />
places. Not minimum but maximum<br />
parking standards.<br />
�Bollards installed to limit sidewalk<br />
parking (Bogota, Columbia)<br />
�Information-based parking<br />
From Michael Replogle<br />
management in Europe, US, Japan
Measure it, Manage it, Price it<br />
�Parking regulation, management, enforcement, pricing is<br />
key TDM strategy – needs legal, institutional support<br />
�London sets parking charges to keep average 85%<br />
occupancy<br />
From Michael Replogle<br />
Illegally parked cars block bikeways<br />
and sidewalks in Changzhou
Transport demand management:<br />
Regulatory controls<br />
Prohibition on motor vehicles from being driven into<br />
central areas on certain days of the week<br />
“Odd-even” or other licenseplate<br />
based schemes attempt<br />
to keep each vehicle from<br />
being driven 1-2 days a week<br />
•Mexico City<br />
•Bogota<br />
•Sao Paulo<br />
•Manila<br />
Multiple side-effects limit their<br />
effectiveness
Making number plate restrictions work<br />
Mechanisms to avoid purchases of second cars<br />
(otherwise, number plate restrictions can encourage<br />
used car purchases)<br />
1. Apply restriction to peak periods only<br />
2. Ban four numbers each day (instead of<br />
two)<br />
3. Change number combinations quarterly<br />
or bi-annually<br />
4. Vehicle registrations at the same<br />
address receive same ending plate<br />
number<br />
5. Require new number plates for used<br />
car purchases
Socialization and Marketing:<br />
Building Public Support<br />
�Consumption patterns, attitudes respond to<br />
marketing, education, choices, pricing<br />
�Community and private sector involvement key<br />
to winning acceptance of reforms
Car Free Days<br />
�Changing cultural & institutional perceptions<br />
�Showing biking as fashionable, high status activity and<br />
good fun for middle and upper class<br />
�Building economic development opportunities, support<br />
for bikeway development<br />
�Good models: Bogota, Curitiba
Today leaders will put TDM at the heart of their efforts<br />
to foster healthy, economically successful cities<br />
3
Transportation Demand Management (TDM)<br />
Training document<br />
Contents<br />
• Road Pricing and Congestion<br />
Charging<br />
• Parking measures<br />
• Physical restraint measures<br />
• Fuel pricing, vehicle taxation,<br />
environmentally oriented taxation<br />
• Land use<br />
• Public transport<br />
• Case studies of TDM measures<br />
Available in English and Spanish<br />
Free download at<br />
www.sutp.org
For more information and documents<br />
www.gtz.de/transport<br />
www.gtz.de/fuelprices<br />
www.gtz.de/climateandtransport<br />
www.gtz.de/roadsafety<br />
www.sutp.org
GIZ SUTP project<br />
sutp@sutp.org<br />
transport@giz.de