download PDF - DTZ Zadelhoff
download PDF - DTZ Zadelhoff
download PDF - DTZ Zadelhoff
- No tags were found...

Create successful ePaper yourself
Turn your PDF publications into a flip-book with our unique Google optimized e-Paper software.
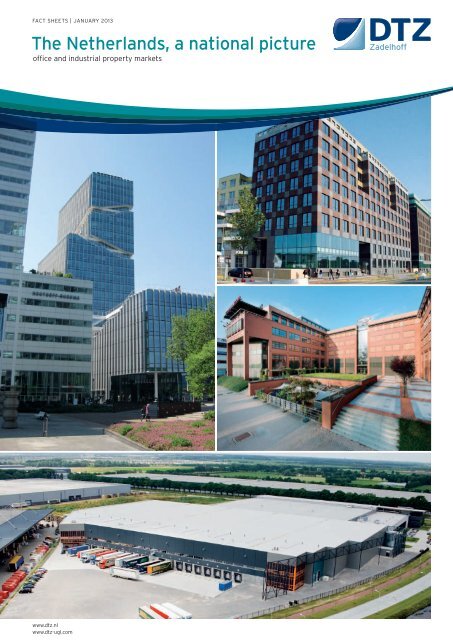
FACT SHEETS | JANUARY 2013Table of contentsOffice marketIndustrial marketRegion4345474951535557596163656769717375777980The NetherlandsAlmereAmsterdam and surrounding areaArnhem and NijmegenBreda and surrounding areaThe Hague and surrounding areaEde and VeenendaalEindhoven and surrounding areaFrieslandGooi and EemlandGroningen, Assen and EmmenHaarlemmermeer’s-Hertogenbosch, Tilburg and WaalwijkLimburgRotterdam and surrounding areaTwenteUtrecht and surrounding areaZwolle, Apeldoorn and DeventerReal estate dataGeneral data4
FACT SHEETS | JANUARY 2013AlmereOffice marketIndustrial marketTable of contentsOffice jobs29,2502011 vs. 20102.7%Availability171,000 sqm2012 vs. 201116%Stock588,000 sqm2012 vs. 20110%Take-up6,000 sqm2012 vs. 201143%Vacancy144,000 sqm (24.6%)2012 vs. 201110%Rents*€ 107 per sqm/year2012 vs. 2011*Incentives excluded12%Office jobs index2005=100Stock in usex 1,000 sqm ( ≥ 500 sqm lfa)150600140500130400120300110200100100902005200620072008200920102011020052006 2007 2008 2009 2010 2011 2012AlmereThe NetherlandsStockStock in useVacancy (24.6% 2012)Source: LISASource: Bak, <strong>DTZ</strong> <strong>Zadelhoff</strong>Take-up and availabilityx 1,000 sqm ( ≥ 500 sqm lfa)180150120906030Vacancy% of stock ( ≥ 500 sqm lfa)30252015105020052006 2007 2008 2009 2010 2011 20120AlmereZwolleLelystadHilversumAmsterdamDiemenTake-up Availability Average take-up 2005 - 2012Vacancy 2011 Vacancy 2012 Dutch average 2012Take-up by user categoryouter ring 2011-2012, inner ring 2002-2012 ( ≥ 500 sqm lfa)19%19%36% 40%6%3%25%36%8% 8%AlmereIndustry, trade and transportBusiness services17%25%19%35%9%5%32%6%4%48%The NetherlandsIT Banking and insurancePublic and non-profit organisationsAvailability by size categoryx 1,000 sqm ( ≥ 500 sqm lfa)18015012090603002005 2006 2007 2008 2009 2010 2011 2012500-1,000 1,000-2,500 2,500-5,000 5,000-10,000 >10,0007
FACT SHEETS | JANUARY 2013AlmereOffice marketIndustrial marketTable of contentsOffice locations1 Centre2 Muziekwijk3 Almere Poort4 Gooisekant/Gooise Poort5 Almere Harbor12Almere435Large-scale transactions office space2012Town/City Location Tendant/Purchaser Floor spaceAlmere Gooisekant/Gooise Poort GPS Buddy1,200MuziekwijkVesting finance1,100CentreRechtbank Midden-Nederland 1,000Gooisekant/Gooise Poort Blokzijl techniek bv850Gross initial yieldsin %Rents for office spacein euro per sqm/year*2011 2012Town/City Location from to from toAlmere CentreMuziekwijkGooisekant/Gooise PoortAlmere Harbor110110957019014015013090957570180125130110*Incentives excluded2011 2012Region Location from to from toEast Best locationsOther locations7.008.509.0010.507.508.509.5012.00West Best locationsOther locations6.107.508.0010.006.407.758.5011.008
FACT SHEETS | JANUARY 2013Amsterdam and surrounding areaAmsterdam, Diemen and AmstelveenOffice marketIndustrial marketTable of contentsOffice jobs265,8502011 vs. 20100.1%Availability1,341,000 sqm2012 vs. 20111.4%Stock6,999,000 sqm2012 vs. 20110.4%Take-up281,000 sqm2012 vs. 201125%Vacancy1,264,000 sqm (18.1%)2012 vs. 20113.0%Rents*€ 196 per sqm/year2012 vs. 2011*Incentives excluded1.8%Office jobs index2005=100Stock in usex 1,000 sqm ( ≥ 500 sqm lfa)1151101051009520052006200720082009201020118,0007,0006,0005,0004,0003,0002,0001,000020052006 2007 2008 2009 2010 2011 2012Amsterdam and surrounding areaThe NetherlandsStockStock in useVacancy (18.1% 2012)Source: LISASource: Bak, <strong>DTZ</strong> <strong>Zadelhoff</strong>Take-up and availabilityx 1,000 sqm ( ≥ 500 sqm lfa)Vacancy% of stock ( ≥ 500 sqm lfa)1,500281,20090024201660030012840 2005 2006 2007 2008 2009 2010 2011 20120AmsterdamDiemenAmstelveenRotterdamThe HagueUtrechtTake-up Availability Average take-up 2005 - 2012Vacancy 2011 Vacancy 2012 Dutch average 2012Take-up by user categoryouter ring 2011-2012, inner ring 2002-2012 ( ≥ 500 sqm lfa)23% 20%16%28%9% 7%8%8%39%25%35%32%17%19%6%9% 4%5%42%Amsterdam and48%surrounding areaThe NetherlandsIndustry, trade and transport IT Banking and insuranceBusiness servicesPublic and non-profit organisationsAvailability by size categoryx 1,000 sqm ( ≥ 500 sqm lfa)1,5001,2009006003000 2005 2006 2007 2008 2009 2010 2011 2012500-1,000 1,000-2,500 2,500-5,000 5,000-10,000 >10,0009
FACT SHEETS | JANUARY 2013Amsterdam and surrounding areaAmsterdam, Diemen and AmstelveenOffice marketIndustrial marketTable of contentsOffice locations1 Teleport/Sloterdijk42 Westas3 Riekerpolder4 North115Amsterdam5 Southern IJ-Oevers6 Centre7 Old South658 Zuidas9 Buitenveldert10 Amstelveen11 De Omval12 Amstel Business Park13 Diemen14 South-East23 897111213Diemen15 Houthavens0Schiphol10Amstelveen14Large-scale transactions office space2012Town/City Location Tendant/Purchaser Floor spaceAmsterdam South-East Nuon Energy26,000South-EastING20,000ZuidasStibbe14,400ZuidasSpaces8,700CentreEyeworks8,400South-EastGraydon6,000Southern IJ-oevers D.E. Master Blenders 17135,450Gross initial yieldsin %2011 2012Region Location from to from toWest Best locations6.10 8.00 6.40 8.50Other locations7.50 10.00 7.75 11.00Rents for office spacein euro per sqm/year*2011 2012Town/City Location from to from toAmsterdam Teleport/SloterdijkWestasRiekerpolderAmsterdam-NorthSouthern IJ-Oevers/HouthavensCentreOld SouthZuidasBuitenveldertDe OmvalAmstel Business ParkSouth-East125851751451801602502201352501109518517521520527535040038529535016519510010015014518516022523013525011080180175215195280350400385290350165195AmstelveenDiemen*Incentives excluded100852001451007019514010
FACT SHEETS | JANUARY 2013Arnhem and NijmegenOffice marketIndustrial marketTable of contentsOffice jobs61,8502011 vs. 20100%Availability259,000 sqm2012 vs. 20118.5%Stock1,589,000 sqm2012 vs. 20110.3%Take-up47,000 sqm2012 vs. 20114.4%Vacancy236,000 sqm (14.8%)2012 vs. 201111%Rents*€ 119 per sqm/year2012 vs. 2011*Incentives excluded2.7%Office jobs index2005=10011511010510095Stock in usex 1,000 sqm ( ≥ 500 sqm lfa)1,6001,200800400902005200620072008200920102011020052006 2007 2008 2009 2010 2011 2012Arnhem and NijmegenThe NetherlandsStockStock in useVacancy (14.8% 2012)Source: LISASource: Bak, <strong>DTZ</strong> <strong>Zadelhoff</strong>Take-up and availabilityx 1,000 sqm ( ≥ 500 sqm lfa)28024020016012080400 2005 2006 2007 2008 2009 2010 2011 2012Take-up Availability Average take-up 2005 - 2012Vacancy% of stock ( ≥ 500 sqm lfa)322824201612840ArnhemNijmegenEdeVeenendaalVacancy 2011 Vacancy 2012 Dutch average 2012Apeldoorn’s-HertogenboschTake-up by user categoryouter ring 2011-2012, inner ring 2002-2012 ( ≥ 500 sqm lfa)19%17%28%25%21%19%31%6%35%8%9% 4%6% 20%5%34%32%29% 4% Arnhem andNijmegen48%The NetherlandsIndustry, trade and transport IT Banking and insuranceBusiness servicesPublic and non-profit organisationsAvailability by size categoryx 1,000 sqm ( ≥ 500 sqm lfa)28024020016012080400 2005 2006 2007 2008 2009 2010 2011 2012500-1,000 1,000-2,500 2,500-5,000 5,000-10,000 >10,00011
FACT SHEETS | JANUARY 2013Arnhem and NijmegenOffice marketIndustrial marketTable of contentsOffice locationsARNHEM1 Station area2 Kroonpark/Groningensingel3 Velperweg4 Gelderse Poort51Arnhem365 Arnhems Buiten6 IJsseloord IINIJMEGEN7 Station area42Duiven10Zevenaar8 Brabantse Poort9 Lindenholt/KerkenbosZEVENAAR10 Mercurion987NijmegenWijchenLarge-scale transactions office space2012Town/City Location Tendant/Purchaser Floor spaceArnhem IJsseloord II Dekra8,700Station areaRGD Kinderbescherming 3,350Weg achter het Bos Collective of artists1,950Nijmegen Industrieweg Pluryn3,000Brabantse PoortScholten Awater2,950Station areaRabobank2,650Gross initial yieldsin %2011 2012Region Location from to from toEast Best locations7.00 9.00 7.50 9.50Other locations8.50 10.50 8.50 12.00Rents for office spacein euro per sqm/year*2011 2012Town/City Location from to from toArnhem Centre/Station areaKroonpark/GroningensingelVelperwegGelderse PoortArnhems BuitenIJsseloord II90110100110951151851401351351401659010510011090115185135125130135160Nijmegen Centre/Station areaBrabantse PoortLindenholt/Kerkenbos10090901751251201009080170120115Zevenaar Mercurion90 120 90 120*Incentives excluded12
FACT SHEETS | JANUARY 2013Breda and surrounding areaBreda, Oosterhout, Etten-Leur, Bergen op Zoom and RoosendaalOffice marketIndustrial marketTable of contentsOffice jobs54,5002011 vs. 20101.0%Availability183,000 sqm2012 vs. 201117%Stock1,096,000 sqm2012 vs. 20110.3%Take-up19,000 sqm2012 vs. 201158%Vacancy155,000 sqm (14.1%)2012 vs. 20116.6%Rents*€ 118 per sqm/year2012 vs. 2011*Incentives excluded3.0%Office jobs index2005=10012011511010510095Stock in usex 1,000 sqm ( ≥ 500 sqm lfa)1,2001,000800600400200902005200620072008200920102011020052006 2007 2008 2009 2010 2011 2012Breda and surrounding areaThe NetherlandsStockStock in useVacancy (14.1% 2012)Source: LISASource: Bak, <strong>DTZ</strong> <strong>Zadelhoff</strong>Take-up and availabilityx 1,000 sqm ( ≥ 500 sqm lfa)Vacancy% of stock ( ≥ 500 sqm lfa)20018016014012010080604020020052006 2007 2008 2009 2010 2011 201220151050BredaOosterhoutEtten-LeurBergen op ZoomRoosendaalTake-up Availability Average take-up 2005 - 2012Vacancy 2011 Vacancy 2012 Dutch average 2012Take-up by user categoryouter ring 2011-2012, inner ring 2002-2012 ( ≥ 500 sqm lfa)63%41%12%1%22%4%24%2%31%25%35%32%17%19%6%9% 4%5%Breda and48%surrounding areaThe NetherlandsIndustry, trade and transport IT Banking and insuranceBusiness servicesPublic and non-profit organisationsAvailability by size categoryx 1,000 sqm ( ≥ 500 sqm lfa)200180160140120100806040200 2005 2006 2007 2008 2009 2010 2011 2012500-1,000 1,000-2,500 2,500-5,000 5,000-10,000 >10,00013
FACT SHEETS | JANUARY 2013Breda and surrounding areaBreda, Oosterhout, Etten-Leur, Bergen op Zoom and RoosendaalOffice marketIndustrial marketTable of contentsOffice locationsBREDA ANDSURROUNDING AREAOosterhout1 Centre/Station area2 Claudius Prinsenlaan893 Ettense Baan4 Westerhagelaan area5 Moleneind46 Digit Parc7 Stadionkwartier8 Europark9 Hoevestein10 1137 61 Breda2510 Bredaseweg11 Parklaan/TriviumEtten-LeurROOSENDAAL /BERGEN OP ZOOMA171 Centre RoosendaalE312A582 Bovendonk3 Centre Bergen op ZoomA4Roosendaal12E312A583Bergen op ZoomA402 km© GeoMedia 2008 [7157]Large-scale transactions office space2012Town/City Location Tendant/Purchaser Floor spaceRoosendaal Bovendonk Stichting Groenhuysen3,750Breda Druivenstraat Mazars Paardekooper Hoffman 2,250Claudius Prinsenlaan Stichting Amarant1,500MinervumPieterman & Partners bv1,100CentreStichting Momentum GGZ800Etten-Leur Bredaseweg BIP Holland bv1,150Gross initial yieldsin %2011 2012Region Location from to from toSouth Best locations7.00 9.00 7.50 9.50Other locations8.50 10.50 8.50 11.00Rents for office spacein euro per sqm/year*2011 2012Town/City Location from to from toBredaCentre/Station areaClaudius PrinsenlaanEttense BaanWesterhagelaan e.o.MoleneindDigit ParcStadionkwartier9012010010075150145160150150150125165165901209010070150145150150140140125165165Oosterhout EuroparkHoevestein115120135135100120135135Etten-Leur Centre90 150 90 140Bredaseweg/Parklaan/Trivium 120 145 120 140Roosendaal CentreBovendonk8010014013075100135130Bergen op Zoom Centre*Incentives excluded75 145 75 13514
FACT SHEETS | JANUARY 2013The Hague and surrounding areaThe Hague, Leiden, Rijswijk, Leidschendam-Voorburg, Delft, Zoetermeer and GoudaOffice marketIndustrial marketTable of contentsOffice jobs213,2002011 vs. 20101.1%Availability1,200,000 sqm2012 vs. 20114.7%Stock7,201,000 sqm2012 vs. 20110%Take-up118,000 m 22012 vs. 201137%Vacancy1,005,000 sqm (14.0%)2012 vs. 20111.0%Rents*€ 128 per sqm/year2012 vs. 2011*Incentives excluded8.5%Office jobs index2005=100Stock in usex 1,000 sqm ( ≥ 500 sqm lfa)1151101051009520052006200720082009201020118,0007,0006,0005,0004,0003,0002,0001,000020052006 2007 2008 2009 2010 2011 2012The Hague and surrounding areaThe NetherlandsStockStock in useVacancy (14.0% 2012)Source: LISASource: Bak, <strong>DTZ</strong> <strong>Zadelhoff</strong>Take-up and availabilityx 1,000 sqm ( ≥ 500 sqm lfa)1,4001,2001,0008006004002000 2005 2006 2007 2008 2009 2010 2011 2012Take-up Availability Average take-up 2005 - 2012Vacancy% of stock ( ≥ 500 sqm lfa)35302520151050LeidenThe HagueRijswijkLeidschendam-VoorburgDelftVacancy 2011 Vacancy 2012 Dutch average 2012ZoetermeerGoudaTake-up by user categoryouter ring 2011-2012, inner ring 2002-2012 ( ≥ 500 sqm lfa)9%3%17%16% 2%25%34%19%6%46% 7%35%9% 4%4%5%27%32%52%The Hague and48%surrounding areaThe NetherlandsIndustry, trade and transport IT Banking and insuranceBusiness servicesPublic and non-profit organisationsAvailability by size categoryx 1,000 sqm ( ≥ 500 sqm lfa)1,4001,2001,0008006004002000 2005 2006 2007 2008 2009 2010 2011 2012500-1,000 1,000-2,500 2,500-5,000 5,000-10,000 >10,00015
FACT SHEETS | JANUARY 2013The Hague and surrounding areaThe Hague, Leiden, Rijswijk, Leidschendam-Voorburg, Delft, Zoetermeer and GoudaOffice marketIndustrial marketTable of contentsOffice locations1 New Centre2 Beatrixkwartier3 CS Kwadrant4 Congress centre area5 In de Boogaard6 Hoornwijck7 Rokkeveen4148 Binckhorst9 Laakhaven HS10 Ypenburg11 Forepark12 Plaspoelpolder13 Delft-NorthThe Hague31928Leidschendam-Voorburg111614 Hofzichtpark/Mariahoeve15 Boerhaavelaan610Zoetermeer1516 City centre Zoetermeer5127Rijswijk13Large-scale transactions office space2012Town/City Location Tendant/Purchaser MetrageThe Hague South-Hollandlaan Spaces10,200Beatrixkwartier Mn Services7,250Laakhaven HS Palier7,000CS Kwadrant Property Works5,000South-Hollandplein Bird & Bird4,000Zoetermeer Rokkeveen Ortec6,250Leiden Centre ID College5,150Gross initial yieldsin %2011 2012Region Location from to from toWest Best locations6.10 8.00 6.40 8.50Other locations7.50 10.00 7.75 11.00Rents for office spacein euro per sqm/year*2011 2012Town/City Location from to from toThe Hague New CentreBeatrixkwartierCS KwadrantCongress centre areaBinckhorstLaakhaven HSYpenburgForeparkHofzichtpark/Mariahoeve15015016514585801001301002152102201801651501901701501501501651256080100110100190200200160125125170140150Rijswijk In de BoogaardHoornwijckPlaspoelpolder9010060140140145808060125125125DelftDelft-North90 140 90 125Zoetermeer RokkeveenBoerhaavelaanCity centre909090145145145909090130130135LeidenBio-scienceparkCentral Station140125185185140125165170Leidschendam-Voorburg90 145 75 125GoudaGoudse Poort90 135 90 130*Incentives excluded16
FACT SHEETS | JANUARY 2013Ede and VeenendaalOffice marketIndustrial marketTable of contentsOffice jobs20,5502011 vs. 20100.7%Availability99,000 sqm2012 vs. 20113.2%Stock421,000 sqm2012 vs. 20110.3%Take-up11,000 sqm2012 vs. 201118%Vacancy95,000 sqm (22.5%)2012 vs. 20116.4%Rents*€ 107 per sqm/year2012 vs. 2011*Incentives excluded1.5%Office jobs index2005=10011511010510095Stock in usex 1,000 sqm ( ≥ 500 sqm lfa)45036027018090902005200620072008200920102011020052006 2007 2008 2009 2010 2011 2012Ede and VeenendaalThe NetherlandsStockStock in useVacancy (22.5% 2012)Source: LISASource: Bak, <strong>DTZ</strong> <strong>Zadelhoff</strong>Take-up and availabilityx 1,000 sqm ( ≥ 500 sqm lfa)Vacancy% of stock ( ≥ 500 sqm lfa)12010080604020020052006 2007 2008 2009 2010 2011 2012322824201612840EdeVeenendaalUtrechtAmersfoortArnhemNijmegenTake-up Availability Average take-up 2005 - 2012Vacancy 2011 Vacancy 2012 Dutch average 2012Take-up by user categoryouter ring 2011-2012, inner ring 2002-2012 ( ≥ 500 sqm lfa)13%35%20%33%11% 22%3%33%17%25%19%35%9%5%32%6%4%30%48%Ede and VeenendaalThe NetherlandsIndustry, trade and transport IT Banking and insuranceBusiness servicesPublic and non-profit organisationsAvailability by size categoryx 1,000 sqm ( ≥ 500 sqm lfa)120100806040200 2005 2006 2007 2008 2009 2010 2011 2012500-1,000 1,000-2,500 2,500-5,000 5,000-10,000 >10,00017
FACT SHEETS | JANUARY 2013Ede and VeenendaalOffice marketIndustrial marketTable of contentsOffice locations1 Veenendaal-Centre2 De Faktorij/De Vendel3 De Batterijen4 De Compagnie5 Ede station area6 De Vallei7 Edese Manen32 4Ede88 Ede-Centre9 Horapark1Veenendaal6759Large-scale transactions office space2012Town/City Location Tendant/Purchaser Floor spaceVeenendaal De Batterijen Unit43,100De Smalle Zijde KONE1,700Ede Galvanistraat Stichting Opella1,250De ValleiAboma1,250Gross initial yieldsin %2011 2012Region Location from to from toEast Best locations7.00 9.00 7.50 9.50Other locations8.50 10.50 8.50 12.00Rents for office spacein euro per sqm/year*2011 2012Town/City Location from to from toEdeDe ValleiEdese ManenEde-CentreHoraparkStation area115909511590135135135130130110809511090135135135130130Veenendaal Veenendaal-CentreDe Faktorij/De VendelDe BatterijenDe Compagnie909011090125120135120908011090125120135120*Incentives excluded18
FACT SHEETS | JANUARY 2013Eindhoven and surrounding areaEindhoven, Helmond, Best, Son en Breugel and VeldhovenOffice marketIndustrial marketTable of contentsOffice jobs74,4502011 vs. 20102.3%Availability289,000 sqm2012 vs. 20113.4%Stock1,895,000 sqm2012 vs. 20110.5%Take-up34,000 m 22012 vs. 201143%Vacancy260,000 sqm (13.7%)2012 vs. 20111.6%Rents*€ 124 per sqm/year2012 vs. 2011*Incentives excluded0.9%Office jobs index2005=100130Stock in usex 1,000 sqm ( ≥ 500 sqm lfa)2,0001201,5001101,000100500902005200620072008200920102011020052006 2007 2008 2009 2010 2011 2012Eindhoven and surrounding areaThe NetherlandsStockStock in useVacancy (13.7% 2012)Source: LISASource: Bak, <strong>DTZ</strong> <strong>Zadelhoff</strong>Take-up and availabilityx 1,000 sqm ( ≥ 500 sqm lfa)30025020015010050Vacancy% of stock ( ≥ 500 sqm lfa)30252015105020052006 2007 2008 2009 2010 2011 20120Eindhoven Son en Breugel VeldhovenBestHelmondTilburgTake-up Availability Average take-up 2005 - 2012Vacancy 2011 Vacancy 2012 Dutch average 2012Take-up by user categoryouter ring 2011-2012, inner ring 2002-2012 ( ≥ 500 sqm lfa)12%20%17%25%22%19%26%6%19%35%9% 4%13%5%36% 3% 3%32%46%Eindhoven and48%surrounding areaThe NetherlandsIndustry, trade and transport IT Banking and insuranceBusiness servicesPublic and non-profit organisationsAvailability by size categoryx 1,000 sqm ( ≥ 500 sqm lfa)3002502001501005002005 2006 2007 2008 2009 2010 2011 2012500-1,000 1,000-2,500 2,500-5,000 5,000-10,000 >10,00019
FACT SHEETS | JANUARY 2013Eindhoven and surrounding areaEindhoven, Helmond, Best, Son en Breugel and VeldhovenOffice marketIndustrial marketTable of contentsOffice locationsSon en Breugel1 Station area2 Centre3 StadionkwartierBest114 Ring5 Kennedy Business District6 Strijp S7 Poort van Metz1215Helmond88 Helmond Centre9 Park Diepenvoorde10 Flight Forum11 Science Park Eindhoven12 Breeven13 Eindhoven Airport14 De Hurk/Croy15 Groot Schooten16 De Run01310Veldhoven671443512Eindhoven169Large-scale transactions office space2012Town/city Location Tendant/Purchaser Floor spaceEindhoven High Tech Campus ASML6,600VitruviuswegStichting RINO Zuid2,250Karel de Grotelaan Stichting Archipel2,050ZernikestraatAlexander Calder1,350Son Science Park Eindhoven Beton Son2,550Best Bosseweg Heijmans1,900Gross initial yieldsin %2011 2012Region Location from to from toSouth Best locations7.00 9.00 7.50 9.50Other locations8.50 10.50 8.50 11.00Rents for office spacein euro per sqm/year*2011 2012Town/City Location from to from toEindhoven Centre/StadionkwartierRingKennedy Business DistrictStrijp SPoort van Metz12012016065130175140175901401201201606513017514017590140Flight Forum/Eindhoven Airport 120 145 115 145De Hurk/Croy90 140 90 140Helmond CentreGroot Schooten85901201258090120120WaalrePark Diepenvoorde125 145 125 140BestBreeven90 125 85 125SonScience Park Eindhoven 120 130 120 130Veldhoven De Run90 120 85 120*Incentives excluded20
FACT SHEETS | JANUARY 2013FrieslandLeeuwarden, Heerenveen and DrachtenOffice marketIndustrial marketTable of contentsOffice jobs35,9002011 vs. 20100.3%Availability102,000 sqm2012 vs. 20116.0%Stock786,000 sqm2012 vs. 20110.1%Take-up5,000 sqm2012 vs. 201167%Vacancy95,000 sqm (12.1%)2012 vs. 20116.6%Rents*€ 100 per sqm/year2012 vs. 2011*Incentives excluded3.1%Office jobs index2005=100115Stock in usex 1,000 sqm ( ≥ 500 sqm lfa)800110600105400100200952005200620072008200920102011020052006 2007 2008 2009 2010 2011 2012FrieslandThe NetherlandsStockStock in useVacancy (12.1% 2012)Source: LISASource: Bak, <strong>DTZ</strong> <strong>Zadelhoff</strong>Take-up and availabilityx 1,000 sqm ( ≥ 500 sqm lfa)12010080604020Vacancy% of stock ( ≥ 500 sqm lfa)252015105020052006 2007 2008 2009 2010 2011 20120HeerenveenLeeuwardenSmallingerlandGroningenAssenTake-up Availability Average take-up 2005 - 2012Vacancy 2011 Vacancy 2012 Dutch average 2012Take-up by user categoryouter ring 2011-2012, inner ring 2002-2012 ( ≥ 500 sqm lfa)59% 52%2%12%4%9% 39%23%17%25%19%35%9%5%32%6%4%48%FrieslandThe NetherlandsIndustry, trade and transport IT Banking and insuranceBusiness servicesPublic and non-profit organisationsAvailability by size categoryx 1,000 sqm ( ≥ 500 sqm lfa)1201008060402002005 2006 2007 2008 2009 2010 2011 2012500-1,000 1,000-2,500 2,500-5,000 5,000-10,000 >10,00021
FACT SHEETS | JANUARY 2013FrieslandLeeuwarden, Heerenveen and DrachtenOffice marketIndustrial marketTable of contentsOffice locationsLEEUWARDEN1 Station area2 Oostergoweg3 Tesselschadestraat4 FEC-City5 Lange MarktstraatDRACHTEN1 Centre2 Business park3 Azeven4 35Leeuwarden12123HeerenveenHEERENVEEN1 K.R. Poststraat2 Station area3 Abe Lenstra BoulevardDrachten1 2 3Large-scale transactions office space2012Town/City Location Tendant/Purchaser Floor spaceLeeuwarden OostergowegStichting Jeugdhulp Friesland 1,450Drachten Burgemeester Wuiteweg ZuidOostZorg750Business parkDGMR650Heerenveen Station areaTromp Partners en Architecten 700Station areaFlanderijn en Van den Borg 650Gross initial yieldsin %2011 2012Region Location from to from toNorth Best locationsOther locations7.758.509.5011.008.008.5010.0012.00Rents for office spacein euro per sqm/year*2011 2012Town/City Location from to from toLeeuwarden Station areaOostergowegTesselschadestraatFEC-CityLange Marktstraat90808080901201001101101208080808085120100110110120Drachten CentreBusiness parkAzeven8090100120120125808090110120120Heerenveen K.R. PoststraatStation areaAbe Lenstra Boulevard8580100120100125808090115100120Sneek*Incentives excluded80 110 80 11022
FACT SHEETS | JANUARY 2013Gooi and EemlandAmersfoort and HilversumOffice marketIndustrial marketTable of contentsOffice jobs50,4002011 vs. 20100.3%Availability261,000 sqm2012 vs. 20118.1%Stock1,459,000 sqm2012 vs. 20110.7%Take-up35,000 sqm2012 vs. 201124%Vacancy256,000 sqm (17.5%)2012 vs. 20118.0%Rents*€ 138 per sqm/year2012 vs. 2011*Incentives excluded2.4%Office jobs index2005=100115110105100Stock in usex 1,000 sqm ( ≥ 500 sqm lfa)1,5001,200900600300952005200620072008200920102011020052006 2007 2008 2009 2010 2011 2012Gooi and EemlandThe NetherlandsStockStock in useVacancy (17.5% 2012)Source: LISASource: Bak, <strong>DTZ</strong> <strong>Zadelhoff</strong>Take-up and availabilityx 1,000 sqm ( ≥ 500 sqm lfa)Vacancy% of stock ( ≥ 500 sqm lfa)2802402001601208040020052006 2007 2008 2009 2010 2011 2012322824201612840AmersfoortHilversumUtrechtAlmereEdeVeenendaalTake-up Availability Average take-up 2005 - 2012Vacancy 2011 Vacancy 2012 Dutch average 2012Take-up by user categoryouter ring 2011-2012, inner ring 2002-2012 ( ≥ 500 sqm lfa)14%17%29%25%27% 20%19%35%19%9%13%5%9%31% 3%32%6%4%35%48%Gooi and EemlandThe NetherlandsIndustry, trade and transport IT Banking and insuranceBusiness servicesPublic and non-profit organisationsAvailability by size categoryx 1,000 sqm ( ≥ 500 sqm lfa)280240200160120804002005 2006 2007 2008 2009 2010 2011 2012500-1,000 1,000-2,500 2,500-5,000 5,000-10,000 >10,00023
FACT SHEETS | JANUARY 2013Gooi and EemlandAmersfoort and HilversumOffice marketIndustrial marketTable of contentsOffice locationsAMERSFOORT1 Station area Southside82 Station area Northside3 Historic city centre/Stadsring44 De Brand5 De Berg6 Podium7 De Hoef8 CalveenHILVERSUMAmersfoort762Hilversum11 Station area2 Mediapark3 Business park ArenA12 335Large-scale transactions office space2012Town/City Location Tendant/Purchaser Floor spaceAmersfoort Station area Southside Huis voor de gezondheid 7,000Station area Southside Nedasco bv2,700De BrandCROP1,400CalveenOogziekenhuis Zonnestraal 1,400Hilversum Bergweg Talpa5,000MediaparkTalpa4,000Gross initial yieldsin %2011 2012Region Location from to from toEast Best locations7.00 9.00 7.50 9.50Other locations8.50 10.50 8.50 12.00West Best locationsOther locations6.107.508.0010.006.407.758.5011.00Rents for office spacein euro per sqm/year*2011 2012Town/City Location from to from toAmersfoort Station areaHistoric city centre/StadsringDe BergPodiumDe Hoef/Calveen/De Brand12511514514510016513518016013512511014514090155135180155135Hilversum Station areaMediaparkBusiness park ArenA125150135137185170125150135135180165LeusdenZeist BoulevardUtrechtseweg9513014513019018585130135125185185*Incentives excluded24
FACT SHEETS | JANUARY 2013Groningen and AssenOffice marketIndustrial marketTable of contentsOffice jobs56,0502011 vs. 20101.7%Availability191,000 sqm2012 vs. 201118%Stock1,254,000 sqm2012 vs. 20110.2%Take-up23,000 sqm2012 vs. 201131%Vacancy163,000 sqm (13.0%)2012 vs. 201112%Rents*€ 109 per sqm/year2012 vs. 2011*Incentives excluded1.9%Office jobs index2005=10011511010510095Stock in usex 1,000 sqm ( ≥ 500 sqm lfa)1,5001,2501,000750500250902005200620072008200920102011020052006 2007 2008 2009 2010 2011 2012Groningen and AssenThe NetherlandsStockStock in useVacancy (13.0% 2012)Source: LISASource: Bak, <strong>DTZ</strong> <strong>Zadelhoff</strong>Take-up and availabilityx 1,000 sqm ( ≥ 500 sqm lfa)Vacancy% of stock ( ≥ 500 sqm lfa)210180150120906030020052006 2007 2008 2009 2010 2011 201224211815129630GroningenAssenZwolleLeeuwardenHeerenveenTake-up Availability Average take-up 2005 - 2012Vacancy 2011 Vacancy 2012 Dutch average 2012Take-up by user categoryouter ring 2011-2012, inner ring 2002-2012 ( ≥ 500 sqm lfa)43%50%6%7%10% 1%8%4%28%43%17%25%19%6%35%9% 4%5%32%48%Groningen and AssenThe NetherlandsIndustry, trade and transport IT Banking and insuranceBusiness servicesPublic and non-profit organisationsAvailability by size categoryx 1,000 sqm ( ≥ 500 sqm lfa)21018015012090603002005 2006 2007 2008 2009 2010 2011 2012500-1,000 1,000-2,500 2,500-5,000 5,000-10,000 >10,00025
FACT SHEETS | JANUARY 2013Groningen and AssenOffice marketIndustrial marketTable of contentsOffice locationsGRONINGEN351 Kranenburg2 Europapark3 Station area/Verbindingskanaalzone7644 Martini Trade Park5 Corpus den Hoorn-SouthGroningen6 Hunzepark7 Zernike Science Park8 De MeeuwenASSEN1 Kloosterveen2 Station area3 Peelerpark145382Assen1 24 Borgstee5 MesschenveldLarge-scale transactions office space2012Town/City Location Tendant/Purchaser Floor spaceGroningen Kranenburg Grontmij6,400Martini Trade Park Sijtsma3,500Gedempte Zuiderdiep Randstad Nederland1,100Queridolaan Stichting Groene Kruis950Gross initial yieldsin %2011 2012Region Location from to from toNorth Best locationsOther locations7.758.509.5011.008.008.5010.0012.00Rents for office spacein euro per sqm/year*2011 2012Town/City Location from to from toGroningen KranenburgEuropaparkStation area/VerbindingskanaalzoneMartini Trade ParkCorpus den Hoorn-SouthHunzeparkZernike Science ParkDe Meeuwen100115110110959080115130140135130140110100140100115110100959080110130140125125130110100135Assen KloosterveenStation areaPeelerparkBorgsteeMesschenveld901009090100110120110100110901009090100100120110100110*Incentives excluded26
FACT SHEETS | JANUARY 2013HaarlemmermeerHoofddorp, Schiphol, Nieuw-Vennep, Badhoevedorp and LijndenOffice marketIndustrial marketTable of contentsOffice jobs31,7502011 vs. 20106.2%Availability299,000 sqm2012 vs. 20116.0%Stock1,411,000 sqm2012 vs. 20110.8%Take-up54,000 sqm2012 vs. 201127%Vacancy287,000 sqm (20.4%)2012 vs. 20113.1%Rents*€ 149 per sqm/year2012 vs. 2011*Incentives excluded0.8%Office jobs index2005=100115110105100Stock in usex 1,000 sqm ( ≥ 500 sqm lfa)1,5001,200900600300952005200620072008200920102011020052006 2007 2008 2009 2010 2011 2012HaarlemmermeerThe NetherlandsStockStock in useVacancy (20.4% 2012)Source: LISASource: Bak, <strong>DTZ</strong> <strong>Zadelhoff</strong>Take-up and availabilityx 1,000 sqm ( ≥ 500 sqm lfa)35030025020015010050020052006 2007 2008 2009 2010 2011 2012Take-up Availability Average take-up 2005 - 2012Vacancy% of stock ( ≥ 500 sqm lfa)302520151050 Haarlemmermeer AmsterdamDiemenHaarlemAmstelveenLeidenVacancy 2011 Vacancy 2012 Dutch average 2012The HagueTake-up by user categoryouter ring 2011-2012, inner ring 2002-2012 ( ≥ 500 sqm lfa)15%17%25%13% 19%35%25% 42% 48%9%5%3%33%17%32%6%4%4%48%HaarlemmermeerThe NetherlandsIndustry, trade and transport IT Banking and insuranceBusiness servicesPublic and non-profit organisationsAvailability by size categoryx 1,000 sqm ( ≥ 500 sqm lfa)350300250200150100500 2005 2006 2007 2008 2009 2010 2011 2012500-1,000 1,000-2,500 2,500-5,000 5,000-10,000 >10,00027
FACT SHEETS | JANUARY 2013HaarlemmermeerHoofddorp, Schiphol, Nieuw-Vennep, Badhoevedorp and LijndenOffice marketIndustrial marketTable of contentsOffice locationsLijnden1 Hoofddorp-Centre2 Beukenhorst-East3 Beukenhorst-West4 Beukenhorst-SouthBadhoevedorp105 De Hoek-North6 Schiphol-Centre7 Schiphol-East8 Schiphol-Rijk9 Schiphol-South10 BadhoevedorpHoofddorp16Schiphol7342598Nieuw-VennepLarge-scale transactions office space2012Town/City Location Tendant/Purchaser Floor spaceSchiphol Schiphol-Centre Cargill Nederland8,200Schiphol-Centre Douane4,100Schiphol-Centre CBRE Global Investors3,500Hoofddorp Beukenhorst-South Bluewater Energy Services8,000Beukenhorst-East PostNL Pakketten Benelux bv 5,600Beukenhorst-West Crocs Europe bv2,600Beukenhorst-West Reggefiber2,450Gross initial yieldsin %2011 2012Region Location from to from toWest Best locations6.10 8.00 6.40 8.50Other locations7.50 10.00 7.75 11.00Rents for office spacein euro per sqm/year*2011 2012Town/City Location from to from toHoofddorp CentreBeukenhorst-EastBeukenhorst-WestBeukenhorst-SouthDe Hoek-North85140100175951601751502051358513510017585160175145210135Schiphol Schiphol-CentreSchiphol-EastSchiphol-RijkSchiphol-South2001158512535517516016020011585125355175160160BadhoevedorpLijnden*Incentives excluded1001201301459012013014528
FACT SHEETS | JANUARY 2013’s-Hertogenbosch and TilburgOffice marketIndustrial marketTable of contentsOffice jobs61,2002011 vs. 20100.7%Availability220,000 sqm2012 vs. 201130%Stock1,433,000 sqm2012 vs. 20110.5%Take-up45,000 sqm2012 vs. 201135%Vacancy211,000 sqm (14.7%)2012 vs. 201158%Rents*€ 116 per sqm/year2012 vs. 2011*Incentives excluded4.6%Office jobs index2005=100115110105100Stock in usex 1,000 sqm ( ≥ 500 sqm lfa)1,5001,200900600300952005200620072008200920102011020052006 2007 2008 2009 2010 2011 2012’s-Hertogenbosch and TilburgThe NetherlandsStockStock in useVacancy (14.7% 2012)Source: LISASource: Bak, <strong>DTZ</strong> <strong>Zadelhoff</strong>Take-up and availabilityx 1,000 sqm ( ≥ 500 sqm lfa)24020016012080400 2005 2006 2007 2008 2009 2010 2011 2012Take-upAvailability’s-Hertogenbosch ’s-HertogenboschTilburgTilburg Average take-up 2005 - 2012Vacancy% of stock ( ≥ 500 sqm lfa)211815129630’s-HertogenboschTilburgBredaOosterhoutVacancy 2011 Vacancy 2012 Dutch average 2012EindhovenTake-up by user categoryouter ring 2011-2012, inner ring 2002-2012 ( ≥ 500 sqm lfa)17%27%25%25%19%19%33%6%35%7%9% 4%10%5%10%31%32%4%34%’s-Hertogenboschand Tilburg48%The NetherlandsIndustry, trade and transport IT Banking and insuranceBusiness servicesPublic and non-profit organisationsAvailability by size categoryx 1,000 sqm ( ≥ 500 sqm lfa)240200160120804002005 2006 2007 2008 2009 2010 2011 2012500-1,000 1,000-2,500 2,500-5,000 5,000-10,000 >10,00029
FACT SHEETS | JANUARY 2013’s-Hertogenbosch and TilburgOffice marketIndustrial marketTable of contentsOffice locations’S-HERTOGENBOSCH1 High Tech Parc2 Pettelaarpark3 Paleiskwartier4 De Rietvelden/De Vutter5 Brabantpoort6 Maaspoort46185Tilburg3 17 De Brand8 De HervenTILBURG1 Spoorzone’s Hertogenbosch375422 ’t Laar3 Prof. Cobbenhagenlaan area24 Ringbaan West5 KatsbogtenLarge-scale transactions office space2012Town/City Location Tendant/Purchaser Floor space‘s-Hertogenbosch Paleiskwartier Enexis bv7,800Pettelaarpark Pink Roccade2,500Paleiskwartier Arcadis Nederland bv2,450Stationsquare Stichting Cinop1,700Pettelaarpark Van Iersel Luchtman Advocaten 1,650Tilburg Spoorzone Regionale Milieu Dienst3,500Ringbaan North Verenigde Bierens Bedrijven 2,050Gross initial yieldsin %2011 2012Region Location from to from toSouthBest locations7.00 9.00 7.50 9.50Other locations8.50 10.50 8.50 11.00Rents for office spacein euro per sqm/year*2011 2012Town/City Location from to from to‘s-Hertogenbosch De BrandDe HervenDe Rietvelden/De VutterHigh Tech ParcPettelaarparkPaleiskwartier10090757513014014514012014516017090857570120135140135100145160165TilburgSpoorzoneProf. Cobbenhagenlaan e.o.Ringbanen‘t Laar100115110115140140135140100115110100135135130135Zaltbommel Waluwe120 135 110 125*Incentives excluded30
FACT SHEETS | JANUARY 2013LimburgMaastricht (incl. Airport/Beek), Heerlen, Roermond and VenloOffice marketIndustrial marketTable of contentsOffice jobs60,4002011 vs. 20100.2%Availability177,000 sqm2012 vs. 201115%Stock1,542,000 sqm2012 vs. 20113.3%Take-up25,000 sqm2012 vs. 201132%Vacancy169,000 sqm (11.0%)2012 vs. 201113%Rents*€ 119 per sqm/year2012 vs. 2011*Incentives excluded1.5%Office jobs index2005=100Stock in usex 1,000 sqm ( ≥ 500 sqm lfa)115110105100959020052006200720082009201020111,6001,4001,2001,000800600400200020052006 2007 2008 2009 2010 2011 2012LimburgThe NetherlandsStockStock in useVacancy (11.0% 2012)Source: LISASource: Bak, <strong>DTZ</strong> <strong>Zadelhoff</strong>Take-up and availabilityx 1,000 sqm ( ≥ 500 sqm lfa)1801501209060300 2005 2006 2007 2008 2009 2010 2011 2012Take-up Availability Average take-up 2005 - 2012Vacancy% of stock ( ≥ 500 sqm lfa)2520151050Maastricht Heerlen Roermond Eindhoven Helmondincl. AirportVacancy 2011 Vacancy 2012 Dutch average 2012VenloTake-up by user categoryouter ring 2011-2012, inner ring 2002-2012 ( ≥ 500 sqm lfa)22%17%25%24% 21%33%19%6%35%6%9% 4%5%4%45% 4%32%41%48%LimburgThe NetherlandsIndustry, trade and transport IT Banking and insuranceBusiness servicesPublic and non-profit organisationsAvailability by size categoryx 1,000 sqm ( ≥ 500 sqm lfa)18015012090603002005 2006 2007 2008 2009 2010 2011 2012500-1,000 1,000-2,500 2,500-5,000 5,000-10,000 >10,00031
FACT SHEETS | JANUARY 2013LimburgMaastricht (incl. Airport/Beek), Heerlen, Roermond and VenloOffice marketIndustrial marketTable of contentsOffice locationsMAASTRICHT5A731 Centre/Station area2 Randwijck-NorthN2803 Ceramique4 Geusselt5 Maastricht AirportMaastricht141RoermondHEERLEN1 Centre/Station area2 Avantis3 Coriopolis32A73ROERMOND1 CentreVENLO3E34A6721 Centre2 Noorderpoort3 Trade Port31HeerlenA73Venlo12Large-scale transactions office space2012Town/City Location Tendant/Purchaser Floor spaceVenlo Noorderpoort Pulse2,200CentreHAS Hogeschool1,750DiependijkstraatEducational institution 1,250Maastricht Maastricht Airport Open Line2,200Randwijck-NorthStichting Radar1,800Heerlen Oliemolenstraat BAAT Accountants & Fiscalisten 1,800Ruys de Beerenbroucklaan REA College1,400Gross initial yieldsin %2011 2012Region Location from to from toSouthBest locations7.00 9.00 7.50 9.50Other locations8.50 10.50 8.50 11.00Rents for office spacein euro per sqm/year*2011 2012Town/City Location from to from toMaastricht Centre/Station areaRandwijck-NorthCeramiqueGeusseltMaastricht Airport11010012510010018013015513014011010011510090175130150130140Heerlen Centre/Station areaAvantisCoriopolis90901101271151209090110125115120Roermond Centre105 145 105 140Venlo CentreNoorderpoortTrade Port90105901271251059010580125125105Sittard Business park North95 125 95 125Weert Business park North105 125 105 125*Incentives excluded32
FACT SHEETS | JANUARY 2013Rotterdam and surrounding areaRotterdam, Capelle a/d IJssel, Schiedam and DrechtstedenOffice marketIndustrial marketTable of contentsOffice jobs149,0502011 vs. 20101.7%Availability928,000 sqm2012 vs. 20114.0%Stock4,706,000 sqm2012 vs. 20110.2%Take-up107,000 sqm2012 vs. 201128%Vacancy815,000 sqm (17.3%)2012 vs. 201120%Rents*€ 133 per sqm/year2012 vs. 2011*Incentives excluded1.7%Office jobs index2005=10011511010510095Stock in usex 1,000 sqm ( ≥ 500 sqm lfa)5,0004,0003,0002,0001,000902005200620072008200920102011020052006 2007 2008 2009 2010 2011 2012Rotterdam and surrounding areaThe NetherlandsStockStock in useVacancy (17.3% 2012)Source: LISASource: Bak, <strong>DTZ</strong> <strong>Zadelhoff</strong>Take-up and availabilityx 1,000 sqm ( ≥ 500 sqm lfa)1,000800600400200020052006 2007 2008 2009 2010 2011 2012Take-up Availability Average take-up 2005 - 2012Vacancy% of stock ( ≥ 500 sqm lfa)322824201612840 Rotterdam Capelle Schiedam Drechtsteden Bredaa/d IJsselVacancy 2011 Vacancy 2012 Dutch average 2012The HagueTake-up by user categoryouter ring 2011-2012, inner ring 2002-2012 ( ≥ 500 sqm lfa)18% 15%17%25%5%19%30% 27%6%35%9% 4%5%5%1%37%32%Rotterdam and62%48%surrounding areaThe NetherlandsIndustry, trade and transport IT Banking and insuranceBusiness servicesPublic and non-profit organisationsAvailability by size categoryx 1,000 sqm ( ≥ 500 sqm lfa)1,0008006004002000 2005 2006 2007 2008 2009 2010 2011 2012500-1,000 1,000-2,500 2,500-5,000 5,000-10,000 >10,00033
FACT SHEETS | JANUARY 2013Rotterdam and surrounding areaRotterdam, Capelle a/d IJssel, Schiedam and DrechtstedenOffice marketIndustrial marketTable of contentsOffice locations1 Central Station2 Centre763 Kop van Zuid4 Marconiplein/Parklane5 Brainpark6 Alexandrium/Oosterhof7 Rotterdam Airport8 Zuidplein9 Schieveste (Schiedam)Schiedam94123510Capelle a/d IJssel10 Rivium/FascinatioRotterdam8Large-scale transactions office space2012Town/City Location Tendant/Purchaser Floor spaceRotterdam Central Station Robeco Nederland bv16,000Central Station NautaDutilh10,000Central Station Coolblue4,000BrainparkGrontmij3,050Dordrecht Laan van Barcelona Cofely Nederland nv3,650Capelle a/d IJssel Rivium/Fascinatio Technip-EPG3,200Gross initial yieldsin %2011 2012Region Location from to from toWest Best locations6.10 8.00 6.40 8.50Other locations7.50 10.00 7.75 11.00Rents for office spacein euro per sqm/year*2011 2012Town/City Location from to from toRotterdam CentreCentral StationKop van ZuidMarconiplein/ParklaneBrainparkAlexandrium/OosterhofRotterdam AirportZuidplein115150145130135130160100200200188145175165195135100145145120135125150100200200200145175165190135Schiedam Schieveste130 145 120 145Capelle a/d IJssel Rivium/FascinatioBarbizon Capelle Office ParkHoofdweg100120901501301259011590150130125Dordrecht AmstelwijckCentre13010015013513095150135*Incentives excluded34
FACT SHEETS | JANUARY 2013TwenteEnschede, Hengelo and AlmeloOffice marketIndustrial marketTable of contentsOffice jobs40,1502011 vs. 20102.0%Availability167,000 sqm2012 vs. 20118.3%Stock896,000 sqm2012 vs. 20111.3%Take-up32,000 sqm2012 vs. 201144%Vacancy155,000 sqm (17.3%)2012 vs. 201112%Rents*€ 98 per sqm/year2012 vs. 2011*Incentives excluded3.4%Office jobs index2005=100115110105100Stock in usex 1,000 sqm ( ≥ 500 sqm lfa)1,000800600400200952005200620072008200920102011020052006 2007 2008 2009 2010 2011 2012TwenteThe NetherlandsStockStock in useVacancy (17.3% 2012)Source: LISASource: Bak, <strong>DTZ</strong> <strong>Zadelhoff</strong>Take-up and availabilityx 1,000 sqm ( ≥ 500 sqm lfa)2001601208040Vacancy% of stock ( ≥ 500 sqm lfa)252015105020052006 2007 2008 2009 2010 2011 20120EnschedeHengeloAlmeloDeventerTake-up Availability Average take-up 2005 - 2012Vacancy 2011 Vacancy 2012 Dutch average 2012Take-up by user categoryouter ring 2011-2012, inner ring 2002-2012 ( ≥ 500 sqm lfa)33%50%14%13% 8%5%3% 2%29%43%TwenteIndustry, trade and transportBusiness services17%25%19%35%9%5%32%6%4%48%The NetherlandsIT Banking and insurancePublic and non-profit organisationsAvailability by size categoryx 1,000 sqm ( ≥ 500 sqm lfa)200160120804002005 2006 2007 2008 2009 2010 2011 2012500-1,000 1,000-2,500 2,500-5,000 5,000-10,000 >10,00035
FACT SHEETS | JANUARY 2013TwenteEnschede, Hengelo and AlmeloOffice marketIndustrial marketTable of contentsOffice locations1 Enschede-Centre2 Business & Science Park3 Zuiderval4 Hengelo-Centre5 Westermaat(Campus/Oosterbosch)6 Almelo-Centre7 TwentepoortAlmelo76A35E30A15HengeloE30A14A352Enschede310 4 km© GeoMedia 2008 [7157]Large-scale transactions office space2012Town/City Location Tendant/Purchaser Floor spaceEnschede Business & Science Park Demcon Holding bv6,550Business & Science Park Apollo Tyres Global R&D bv 2,450Business & Science Park Mecal Facilities bv1,950Business & Science Park Eshuis Accountants1,500Almelo Centre Sitel Nederland2,200Hengelo Westermaat Visschedijk facilitair2,200Gross initial yieldsin %Rents for office spacein euro per sqm/year*2011 2012Town/City Location from to from toEnschede CentreBusiness & Science ParkZuiderval85801301351351358075125130130135Hengelo CentreWestermaat (Campus/Oosterbosch)75601201257055120125Almelo CentreTwentepoort75701301207070120120*Incentives excluded2011 2012Region Location from to from toEast Best locations7.00 9.00 7.50 9.50Other locations8.50 10.50 8.50 12.0036
FACT SHEETS | JANUARY 2013Utrecht and surrounding areaUtrecht, Stichtse Vecht, Nieuwegein and HoutenOffice marketIndustrial marketTable of contentsOffice jobs127,3002011 vs. 20100.8%Availability597,000 sqm2012 vs. 20119.3%Stock3,638,000 sqm2012 vs. 20112.5%Take-up72,000 sqm2012 vs. 201130%Vacancy484,000 sqm (13.3%)2012 vs. 20114.8%Rents*€ 135 per sqm/year2012 vs. 2011*Incentives excluded1.3%Office jobs index2005=100120115110105100Stock in usex 1,000 sqm ( ≥ 500 sqm lfa)4,0003,2002,4001,600800952005200620072008200920102011020052006 2007 2008 2009 2010 2011 2012Utrecht and surrounding areaThe NetherlandsStockStock in useVacancy (13.3% 2012)Source: LISASource: Bak, <strong>DTZ</strong> <strong>Zadelhoff</strong>Take-up and availabilityx 1,000 sqm ( ≥ 500 sqm lfa)Vacancy% of stock ( ≥ 500 sqm lfa)7003560030500254002030015200101005020052006 2007 2008 2009 2010 2011 20120UtrechtStichtse VechtNieuwegeinHoutenZeistTake-up Availability Average take-up 2005 - 2012Vacancy 2011 Vacancy 2012 Dutch average 2012Take-up by user categoryouter ring 2011-2012, inner ring 2002-2012 ( ≥ 500 sqm lfa)10%17%26%5%25%14%19%9%6%36% 13%35%9% 4%8%5%29%32%50%Utrecht and48%surrounding areaThe NetherlandsIndustry, trade and transport IT Banking and insuranceBusiness servicesPublic and non-profit organisationsAvailability by size categoryx 1,000 sqm ( ≥ 500 sqm lfa)7006005004003002001000 2005 2006 2007 2008 2009 2010 2011 2012500-1,000 1,000-2,500 2,500-5,000 5,000-10,000 >10,00037
FACT SHEETS | JANUARY 2013Utrecht and surrounding areaUtrecht, Stichtse Vecht, Nieuwegein and HoutenOffice marketIndustrial marketTable of contentsOffice locationsUTRECHT1 Station area Utrecht2 Maliebaan/Old Centre3 Rijnsweerd4 Kanaleneiland5 Papendorp6 City centre Leidsche Rijn7 Leidsche Rijn North8 Overvecht9 Lage Weide10 Ouderijn (De Meern)NIEUWEGEIN11 Centre Nieuwegein12 Merwestein13 PlettenburgHOUTEN14 MolenzoomStichtse Vecht15987Utrecht631 21054Nieuwegein121113 14HoutenSTICHTSE VECHT15 Zuilense Ring/BisonspoorLarge-scale transactions office space2012Town/City Location Tendant/Purchaser Floor spaceUtrecht Leidsche Rijn North Capgemini Nederland bv21,000Rijnsweerd VRU3,500Leidsche Rijn Dura Vermeer2,300Station area ProRail2,250Rijnsweerd Remobis Refund Service2,250Overvecht De K.N.S.B2,000Papendorp Caesar1,900Gross initial yieldsin %2011 2012Region Location from to from toWest Best locations6.10 8.00 6.40 8.50Other locations7.50 10.00 7.75 11.00Rents for office spacein euro per sqm/year*2011 2012Town/City Location from to from toUtrecht Station areaRijnsweerdKanaleneilandLage WeideOvervechtPapendorpMaliebaanOld CentreOudenrijn (De Meern)Leidsche Rijn NorthCitycentre Leidsche Rijn170145110901001551601501051752051751601301501902101901401851701351108585150155150100153175210175160130150185200185135185185Nieuwegein CentrePlettenburgMerwestein908590120130120858085115125115Houten Molenzoom110 140 105 135Maarssen Zuilense Ring/Bisonspoor 90 130 85 130*Incentives excluded38
FACT SHEETS | JANUARY 2013Zwolle, Apeldoorn and DeventerOffice marketIndustrial marketTable of contentsOffice jobs76,2002011 vs. 20102.9%Availability338,000 sqm2012 vs. 201127%Stock1,880,000 sqm2012 vs. 20110.4%Take-up28,000 sqm2012 vs. 201131%Vacancy328,000 sqm (17.4%)2012 vs. 201132%Rents*€ 106 per sqm/year2012 vs. 2011*Incentives excluded9.0%Office jobs index2005=10012011511010510095Stock in usex 1,000 sqm ( ≥ 500 sqm lfa)2,0001,6001,200800400902005200620072008200920102011020052006 2007 2008 2009 2010 2011 2012Zwolle, Apeldoorn and DeventerThe NetherlandsStockStock in useVacancy (17.4% 2012)Source: LISASource: Bak, <strong>DTZ</strong> <strong>Zadelhoff</strong>Take-up and availabilityx 1,000 sqm ( ≥ 500 sqm lfa)Vacancy% of stock ( ≥ 500 sqm lfa)35030025020015010050020052006 2007 2008 2009 2010 2011 201224211815129630ZwolleDeventerApeldoornAssenHeerenveenTake-up Availability Average take-up 2005 - 2012Vacancy 2011 Vacancy 2012 Dutch average 2012Take-up by user categoryouter ring 2011-2012, inner ring 2002-2012 ( ≥ 500 sqm lfa)24%44%8%13%14%8%10%13%25%25%35%32%17%19%6%9% 4%5%41%Zwolle, Apeldoorn48%and DeventerThe NetherlandsIndustry, trade and transport IT Banking and insuranceBusiness servicesPublic and non-profit organisationsAvailability by size categoryx 1,000 sqm ( ≥ 500 sqm lfa)350300250200150100500 2005 2006 2007 2008 2009 2010 2011 2012500-1,000 1,000-2,500 2,500-5,000 5,000-10,000 >10,00039
FACT SHEETS | JANUARY 2013Zwolle, Apeldoorn and DeventerOffice marketIndustrial marketTable of contentsOffice locationsZWOLLE1 Hanzeland2 Binnenstad Plus3 Voorsterpoort4 Oosterenk1DeventerDEVENTER1 Centre3 2Zwolle422 Kloosterlanden/Hanzepark1APELDOORN1 Apeldoorn-North2 Centre3 Brouwersmolen4 Malkenschoten123Apeldoorn4Large-scale transactions office space2012Town/City Location Tendant/Purchaser Floor spaceApeldoorn John F. Kennedylaan Divitel2,450Apeldoorn-North Ajax Chubb Varel2,000Deventer Kloosterlanden Agrovision1,450Zwolle Govert Flinckstraat Frion1,100Centrea callcenter1,100Gross initial yieldsin %2011 2012Region Location from to from toNorth Best locationsOther locations7.758.509.5011.008.008.5010.0012.00East Best locationsOther locations7.008.509.0010.507.508.509.5012.00Rents for office spacein euro per sqm/year*2011 2012Town/City Location from to from toApeldoorn Apeldoorn-NorthCentreBrouwersmolenMalkenschoten9085858514014014014075757570130130130130Deventer CentreKloosterlanden/Hanzepark85701301307560125125Zwolle Binnenstad PlusHanzelandVoorsterpoortOosterenk8511011080160150175140709010065150140175130*Incentives excluded40
FACT SHEETS | JANUARY 2013DataOffice marketIndustrial marketTable of contentsMunicipalityTake-up(in sqm)Availability(in sqm)VacancyOffice stock(in sqm)Range of rents(in euro per sqm/year)Almelo 6,000 31,000 15% 191,000 70-120Almere 6,000 171,000 25% 588,000 70-180Amersfoort 22,000 175,000 20% 846,000 90-180Amstelveen 14,000 166,000 26% 648,000 100-195Amsterdam 266,000 1,140,000 18% 6,065,000 80-400Apeldoorn 11,000 118,000 16% 749,000 70-130Arnhem 32,000 213,000 17% 1,119,000 90-185Assen 1,000 53,000 17% 284,000 90-120Bergen op Zoom 0 12,000 11% 101,000 75-135Best 2,000 18,000 18% 101,000 85-125Breda 11,000 125,000 14% 692,000 70-165Capelle aan den IJssel 14,000 149,000 30% 488,000 90-150Delft 2,000 41,000 10% 392,000 90-125Deventer 4,000 79,000 20% 362,000 60-125Diemen 1,000 35,000 12% 286,000 70-140Drechtsteden 10,000 96,000 15% 569,000 95-150Ede 4,000 51,000 20% 248,000 80-135Eindhoven 28,000 199,000 13% 1,425,000 65-175Enschede 21,000 81,000 17% 432,000 75-135Etten-Leur 1,000 8,000 11% 73,000 90-140Gouda 6,000 96,000 26% 342,000 90-130Groningen 22,000 138,000 12% 970,000 80-140Haarlemmermeer 54,000 299,000 20% 1,411,000 85-355Heerenveen 1,000 26,000 24% 112,000 80-120Heerlen 6,000 46,000 10% 467,000 90-125Helmond 1,000 30,000 14% 168,000 80-120Hengelo 5,000 55,000 20% 273,000 55-125Hilversum 13,000 85,000 14% 614,000 125-180Houten 0 41,000 15% 246,000 105-135Leeuwarden 2,000 68,000 11% 579,000 80-120Leiden 13,000 75,000 12% 522,000 125-170Leidschendam-Voorburg 7,000 96,000 34% 283,000 75-125Maastricht (incl, airport/Beek) 11,000 76,000 13% 591,000 90-175Nieuwegein 6,000 160,000 29% 522,000 80-125Nijmegen 15,000 46,000 9% 470,000 80-170Oosterhout 1,000 18,000 15% 116,000 100-135Rijswijk 5,000 216,000 18% 892,000 60-125Roermond 0 28,000 10% 247,000 105-140Roosendaal 7,000 20,000 17% 115,000 75-135Rotterdam 81,000 656,000 16% 3,432,000 100-200Schiedam 1,000 27,000 11% 217,000 120-145's-Hertogenbosch 30,000 124,000 12% 960,000 70-165Smallingerland 2,000 8,000 8% 95,000 80-120Son en Breugel 3,000 20,000 20% 79,000 120-130Stichtse Vecht 0 47,000 25% 164,000 85-130Tilburg 16,000 96,000 20% 473,000 100-135The Hague 66,000 535,000 10% 4,138,000 60-200Utrecht 67,000 349,000 9% 2,706,000 85-210Veenendaal 7,000 48,000 26% 173,000 80-135Veldhoven 0 21,000 15% 122,000 85-120Venlo 8,000 27,000 11% 237,000 80-125Zoetermeer 19,000 141,000 21% 633,000 90-135Zwolle 13,000 140,000 18% 768,000 65-175The Netherlands 1,180,000 7,932,000 14.6% 49,129,000 55-40041
FACT SHEETS | JANUARY 2013General dataOffice marketIndustrial marketTable of contentsMunicipalityInhabitants(in numbers)Labour force(in % of totalpopulation)Private disposablehousehold income(in euros)Officestockper inhabitant(in sqm/inhabitant)Office jobs(in numbers)Almelo 72,750 66% 30,600 2.6 7,900Almere 193,150 71% 35,000 3.0 29,250Amersfoort 148,250 67% 36,800 5.7 30,250Amstelveen 83,350 65% 39,700 7.8 21,600Amsterdam 790,100 73% 30,700 7.7 236,200Apeldoorn 156,950 66% 34,700 4.8 36,050Arnhem 149,250 71% 30,200 7.5 40,750Assen 67,200 66% 31,900 4.2 9,600Bergen op Zoom 66,150 67% 33,300 1.5 5,300Best 28,700 66% 38,300 3.5 5,450Breda 176,400 67% 35,000 3.9 30,600Capelle aan den IJssel 66,100 68% 35,200 7.4 14,600Delft 98,700 73% 32,200 4.0 15,300Deventer 98,650 67% 32,200 3.7 13,050Diemen 24,950 70% 35,400 11.5 8,050Drechtsteden 267,350 66% 34,000 2.1 25,850Ede 108,750 65% 36,500 2.3 13,050Eindhoven 217,250 69% 31,700 6.6 56,450Enschede 158,050 69% 29,300 2.7 20,950Etten-Leur 42,050 67% 35,500 1.7 4,150Gouda 71,250 67% 34,900 4.8 8,800Groningen 193,150 76% 28,700 5.0 46,500Haarlemmermeer 143,950 68% 39,400 9.8 31,750Heerenveen 43,500 64% 32,400 2.6 5,300Heerlen 89,000 67% 28,000 5.2 18,500Helmond 88,800 67% 32,200 1.9 8,200Hengelo 80,950 65% 31,800 3.4 11,350Hilversum 85,550 65% 36,300 7.2 20,150Houten 48,300 68% 42,400 5.1 8,850Leeuwarden 95,300 70% 29,000 6.1 25,600Leiden 118,750 73% 34,100 4.4 14,000Leidschendam-Voorburg 72,400 64% 36,600 3.9 6,800Maastricht (incl, airport/Beek) 137,500 69% 30,800 4.2 24,550Nieuwegein 60,700 70% 35,600 8.6 12,350Nijmegen 165,200 72% 30,600 2.8 21,100Oosterhout 54,000 66% 36,000 2.1 6,200Rijswijk 47,000 65% 33,100 19.0 21,200Roermond 56,150 67% 31,200 4.4 7,500Roosendaal 77,450 66% 33,700 1.5 8,300Rotterdam 616,250 69% 29,500 5.6 98,750Schiedam 76,250 68% 31,000 2.8 9,850's-Hertogenbosch 141,900 69% 34,400 6.8 33,200Smallingerland 55,450 64% 30,900 1.7 5,000Son en Breugel 15,800 60% 41,300 5.0 2,750Stichtse Vecht 63,300 67% 40,200 2.6 7,000Tilburg 207,600 70% 31,500 2.3 28,000The Hague 502,050 70% 31,600 8.2 126,000Utrecht 316,300 73% 34,100 8.6 99,100Veenendaal 62,850 66% 34,800 2.8 7,500Veldhoven 43,900 66% 36,400 2.8 4,600Venlo 100,050 67% 31,100 2.4 9,850Zoetermeer 122,350 70% 36,200 5.2 21,150Zwolle 121,550 68% 33,200 6.3 27,050The Netherlands 16,730,350 67% 34,200 2.9 2,274,40042
FACT SHEETS | JANUARY 2013The NetherlandsOffice marketIndustrial marketTable of contentsOffice jobs3,202,4002011 vs. 20100%Availability9,274,000 sqm2012 vs. 20113.3%Stock52,316,000 ha2012 vs. 20111.2%Take-up2,760,000 m 22012 vs. 20116.5%Availability (% of stock)3.5%2012 vs. 20110.1%Rents€ 47 per sqm/year2012 vs. 20112.2%Industry-sector jobs index2005=100Industrial estate stock(ha)11010510095200520062007200820092010201153,00052,00051,00050,00049,00048,00047,00046,000 2005 2006 2007 2008 2009 2010 2011 20121,4001,2001,0008006004002000The NetherlandsSource: LISAStockSource: VROM/DG Ruimte, edited by <strong>DTZ</strong> <strong>Zadelhoff</strong>Annual allocationTake-up and availabilityx 1,000 sqm ( ≥ 750 sqm lfa)10,0008,0006,0004,0002,0000 20052006 2007 2008 2009 2010 2011 2012Take-up Availability Average take-up 2005 - 2012Availability% of stock ( ≥ 750 sqm lfa)1815129630The Netherlands MoerdijkTilburgRotterdam Sittard-Geleen VenloVacancy 2011 Vacancy 2012 Dutch average 2012EindhovenEmmenTake-up by user categoryouter ring 2011-2012, inner ring 2002-2012 ( ≥ 750 sqm lfa)Availability by size categoryx 1,000 sqm ( ≥ 750 sqm lfa)10,0002%15%2%21%26%34%29%26%25%20%The Netherlands8,0006,0004,0002,0000 2005 2006 2007 2008 2009 2010 2011 2012Industry Trade Transport IT Service-sector750-1,000 1,000-2,500 2,500-5,000 5,000-10,000 >10,00043
FACT SHEETS | JANUARY 2013The NetherlandsOffice marketIndustrial marketTable of contentsGross initial yieldsin %*Vacant space at the municipal levelin % of stock, 20122011 2012Region Location from to from toWestBest locationsOther locations7.509.009.5010.757.759.009.7511.25SouthBest locationsOther locations7.508.759.5011.007.759.009.7511.50EastBest locationsOther locations8.509.5011.0011.509.009.7512.0012.50NorthBest locationsOther locations8.759.5011.5012.008.859.7512.0012.50*excluding distribution centresRents for industrial spacein euro per sqm/year2011 2012Region from to from toGreater AmsterdamRotterdam and surrounding areaThe Hague and surrounding areaUtrecht and surrounding area35352530706270653535253070616865HaarlemmermeerEindhoven and surrounding areaArnhem and NijmegenZwolle, Apeldoorn and Deventer‘s-Hertogenbosch, Tilburg and WaalwijkGooi and EemlandTwenteBreda and surrounding areaGroningen and AssenLimburgAlmereFrieslandEde and Veenendaal3530252530252520202530203011055656555655060505065455535302520302220202025302030110556555526550605050654055Large-scale transactions industrial space2012Town/City Location Tenant/Purchaser Floor spaceSon Ekkersrijt Rhenus Contract Logistics 55,000Rotterdam Galileistraat Commodity business52,000Venlo Eindhovenseweg Brand Loyalty41,650Eindhoven Achtseweg North Van Rooijen Logistiek bv41,600Venray De Blakt Microsoft40,000Venray De Blakt CEVA38,500Maassluis Maasdijk Lely Groep33,000Wijchen Bijsterhuizen Nabuurs Logistiek bv28,700Hilversum Lage Naarderweg DutchView27,000Tilburg Vossenberg Ingram Micro23,400MoerdijkAmsterdamDiemenVeldhovenAmstelveenUtrechtAmersfoortAlmereZoetermeerNieuwegeinEindhovenTilburgWijchenStichtse VechtSchiedamOldenzaalHaarlemmermeerRotterdamEdeRoosendaalVenrayBredaLansingerland's-HertogenboschHilversumCapelle aan den IJsselEtten-LeurHoutenBestRidderkerkThe HagueDeventerEnschedeRijswijkSon en BreugelZwolleArnhemVenloLeidenWaalwijkDuivenDrechtstedenLeeuwardenZevenaarOosterhoutHengeloNijmegenHelmondVeenendaalSmallingerlandGoudaAssenApeldoornEmmenDelftSpijkenisseGroningenHeerenveenAlmeloSittard-GeleenBergen op ZoomVlaardingenOud-BeijerlandBarendrecht0% 3% 6% 9% 12% 15%Dutch Average44
FACT SHEETS | JANUARY 2013AlmereOffice marketIndustrial marketTable of contentsOffice jobs29,5002011 vs. 20100.2%Availability256,000 sqm2012 vs. 201124%Stock489 ha2012 vs. 20112.8%Take-up49,000 sqm2012 vs. 2011102%Availability (% of stock)10.5%2012 vs. 20111.8%Rents€ 44 per sqm/year2012 vs. 20112.5%Industry-sector jobs index2005=100125120115110105100Industrial estate stock(ha)5004003002001003528211479520052006200720082009201020110200520062007200820092010201120120AlmereThe NetherlandsStockAnnual allocationSource: LISASource: VROM/DG Ruimte, edited by <strong>DTZ</strong> <strong>Zadelhoff</strong>Take-up and availabilityx 1,000 sqm ( ≥ 750 sqm lfa)Availability% of stock ( ≥ 750 sqm lfa)280202402001601612120804084020052006 2007 2008 2009 2010 2011 20120AlmereAmsterdamDiemenHilversumZwolleTake-up Availability Average take-up 2005 - 2012Vacancy 2011 Vacancy 2012 Dutch average 2012Take-up by user categoryouter ring 2011-2012, inner ring 2002-2012 ( ≥ 750 sqm lfa)24%20% 22%3%7%18% 33%38%35%Almere2%15%21%2%26%34%29%26%25%20%The NetherlandsAvailability by size categoryx 1,000 sqm ( ≥ 750 sqm lfa)28024020016012080400 2005 2006 2007 2008 2009 2010 2011 2012Industry Trade Transport IT Service-sector750-1,000 1,000-2,500 2,500-5,000 5,000-10,000 >10,00045
FACT SHEETS | JANUARY 2013Office marketIndustrial marketTable of contentsIndustrial estates1 De Vaart2 Veluwsekant3 De Steiger4 Hollandsekant5 Stichtsekant6 Gooisekant/Gooise Poort7 Hogekant/Lagekant8 Sallandsekant9 Poldervlak10 Markerkant7410Almere1298635Large-scale transactions industrial space2012Town/City Location Tenant/Purchaser Floor spaceAlmere Hollandsekant Ahold Real Estate & Construction bv 18,550Hollandsekant Accell Fitness Division bv5,150De VaartA.D. Druk5,000De VaartHemubo Almere bv3,350De VaartFacet Industrial2,700HogekantCambridge Weight Plan Benelux bv 2,150De VaartSummit Europe2,000Gross initial yieldsin %*2011 2012Region Location from to from toEast Best locationsOther locations8.509.5011.0011.509.009.7512.0012.50West Best locationsOther locations7.509.009.5010.757.759.009.7511.25*excluding distribution centresRents for industrial spacein euro per sqm/year2011 2012Region Location from to from toAlmere De VaartVeluwsekantDe SteigerHollandsekantStichtsekantGooisekant/Gooise PoortHogekant/LagekantSallandsekantPoldervlakMarkerkant3045303550454550405055604560606060606565304530354040455040504560456060606060656546
FACT SHEETS | JANUARY 2013Amsterdam and surrounding areaAmsterdam, Diemen and AmstelveenOffice marketIndustrial marketTable of contentsOffice jobs141,8002011 vs. 20101.3%Availability507,000 sqm2012 vs. 20116.5%Stock849 ha2012 vs. 20115.8%Take-up124,000 sqm2012 vs. 20110.5%Availability (% of stock)11.9%2012 vs. 20111.6%Rents€ 48 per sqm/year2012 vs. 20114.3%Industry-sector jobs index2005=10011010510095Industrial estate stock(ha)1,0008006004002002520151059020052006200720082009201020110200520062007200820092010201120120Amsterdam and surrounding areaThe NetherlandsStockAnnual allocationSource: LISASource: VROM/DG Ruimte, edited by <strong>DTZ</strong> <strong>Zadelhoff</strong>Take-up and availabilityx 1,000 sqm ( ≥ 750 sqm lfa)Availability% of stock ( ≥ 750 sqm lfa)600185001540012300920061003020052006 2007 2008 2009 2010 2011 20120Amsterdam The HagueDiemenHaarlemmermeer RotterdamUtrechtTake-up Availability Average take-up 2005 - 2012Vacancy 2011 Vacancy 2012 Dutch average 2012Take-up by user categoryouter ring 2011-2012, inner ring 2002-2012 ( ≥ 750 sqm lfa)Availability by size categoryx 1,000 sqm ( ≥ 750 sqm lfa)60014%15%2% 24%30%29%22%2% 21%26%27% 3%27%24%27%Amsterdam andsurrounding area2%26%34%25%20%The Netherlands50040030020010002005 2006 2007 2008 2009 2010 2011 2012Industry Trade Transport IT Service-sector750-1,000 1,000-2,500 2,500-5,000 5,000-10,000 >10,00047
FACT SHEETS | JANUARY 2013Amsterdam, Diemen and AmstelveenOffice marketIndustrial marketTable of contentsIndustrial estates1 North2 Westpoort3 Amstelveen4 South-East5 Amstel Business Park21AmsterdamDiemen50Schiphol3Amstelveen4Large-scale transactions industrial space2012Plaats Locatie Tenant/Purchaser MetrageAmsterdam Westpoort Vollers Holland23,000Westpoortan int. pharmaceutical company 16,550WestpoortMondo Minerals16,400WestpoortJohn Nurminen Prima bv4,250Jan van Galenstraat Rustenburg Groothandel bv 4,150South-EastTalpa Fictie bv3,500WestpoortHans Struijk Fietsen3,450Gross initial yieldsin %*2011 2012Region Location from to from toWest Best locations7.50 9.50 7.75 9.75Other locations*excluding distribution centres9.00 10.75 9.00 11.25Rents for industrial spacein euro per sqm/year2011 2012Region Location from to from toAmsterdamNorthWestpoortSouth-EastAmstel Business Park45374040606070704537404060607070AmstelveenDiemen/WeespAalsmeer/Uithoorn453540555560453537555060Alkmaar/Heerhugowaard40 65 35 55HaarlemWaarderpolder 45 60 40 55MijdrechtZaanstad403555553535505048
FACT SHEETS | JANUARY 2013Arnhem and NijmegenArnhem, Nijmegen, Wijchen, Duiven and ZevenaarOffice marketIndustrial marketTable of contentsOffice jobs81,2502011 vs. 20100.6%Availability240,000 sqm2012 vs. 201115%Stock1,206 ha2012 vs. 20112.9%Take-up94,000 sqm2012 vs. 201197%Availability (% of stock)4.0%2012 vs. 20110.9%Rents€ 41 per sqm/year2012 vs. 20112.4%Industry-sector jobs index2005=100110Industrial estate stock(ha)1,400351051,2001,00030251008006002015954001090200520062007200820092010201120002005200620072008200920102011201250Arnhem and NijmegenThe NetherlandsStockAnnual allocationSource: LISASource: VROM/DG Ruimte, edited by <strong>DTZ</strong> <strong>Zadelhoff</strong>Take-up and availabilityx 1,000 sqm ( ≥ 750 sqm lfa)Availability% of stock ( ≥ 750 sqm lfa)35016300250122001508100504020052006 2007 2008 2009 2010 2011 20120ArnhemNijmegenDuivenWijchenZevenaarEdeTake-up Availability Average take-up 2005 - 2012Vacancy 2011 Vacancy 2012 Dutch average 2012Take-up by user categoryouter ring 2011-2012, inner ring 2002-2012 ( ≥ 750 sqm lfa)31%22%2%29%3%34%17%23%24%15%Arnhem andNijmegen2%15%21%2%26%34%29%26%25%20%The NetherlandsAvailability by size categoryx 1,000 sqm ( ≥ 750 sqm lfa)3503002502001501005002005 2006 2007 2008 2009 2010 2011 2012Industry Trade Transport IT Service-sector750-1,000 1,000-2,500 2,500-5,000 5,000-10,000 >10,00049
FACT SHEETS | JANUARY 2013Arnhem and NijmegenArnhem, Nijmegen, Wijchen, Duiven and ZevenaarOffice marketIndustrial marketTable of contentsIndustrial estatesNIJMEGEN/WIJCHEN1 North- and East kanaalhaven2 Westkanaaldijk3 Winkelsteeg4 BijsterhuizenArnhem5 6ARNHEM5 ’t Broek/Kleefsche Waard6 IJsseloord II7 Rijkerswoerd879Duiven10Zevenaar11128 De OvermaatDUIVEN9 Nieuwgraaf10 Centerpoort-North/SouthZEVENAAR11 Tatelaar12 Hengelder421NijmegenWijchen3Large-scale transactions industrial space2012Town/City Location Tenant/Purchaser Floor spaceWijchen Bijsterhuizen Nabuurs Logistiek28,700BijsterhuizenPapyrus Groep Nederland 12,600Duiven Centerpoort-North Nedupack Thermoforming 6,200Nijmegen Westkanaaldijk Duynie Holding5,000Arnhem De Overmaat POM bv3,650De OvermaatBallorig kinderspeelparadijs 2,900Gross initial yieldsin %*2011 2012Region Location from to from toEast Best locationsOther locations8.509.5011.0011.509.009.7512.0012.50*excluding distribution centresRents for industrial spacein euro per sqm/year2011 2012Region Location from to from toNijmegen North- and East kanaalhavenWestkanaaldijkWinkelsteeg252525454040252525404040Nijmegen/Wijchen Bijsterhuizen40 55 40 50Arnhem ‘t Broek/Kleefsche WaardIJsseloord IIRijkerswoerd/De Overmaat305030456550305030456545Duiven Nieuwgraaf/Centerpoort-North/South 25 50 25 45Zevenaar TatelaarHengelderKollenburg25252540403525252540403550
FACT SHEETS | JANUARY 2013Breda and surrounding areaBreda, Oosterhout, Moerdijk, Etten-Leur, Bergen op Zoom and RoosendaalOffice marketIndustrial marketTable of contentsOffice jobs110,7502011 vs. 20100.2%Availability700,000 sqm2012 vs. 201127%Stock2,606 ha2012 vs. 20110.4%Take-up189,000 sqm2012 vs. 201142%Availability (% of stock)5.4%2012 vs. 20111.1%Rents€ 40 per sqm/year2012 vs. 20113.4%Industry-sector jobs index2005=100Industrial estate stock(ha)1102,800701052,400 602,000 501001,600 401,200 3095800 20400 109020052006200720082009201020110200520062007200820092010201120120Breda and surrounding areaThe NetherlandsStockAnnual allocationSource: LISASource: VROM/DG Ruimte, edited by <strong>DTZ</strong> <strong>Zadelhoff</strong>Take-up and availabilityx 1,000 sqm ( ≥ 750 sqm lfa)800700600500400300200100020052006 2007 2008 2009 2010 2011 2012Take-up Availability Average take-up 2005 - 2012Availability% of stock ( ≥ 750 sqm lfa)14121086420Bergenop ZoomBredaOosterhoutMoerdijkVacancy 2011 Vacancy 2012 Dutch average 2012Etten-LeurRoosendaalTake-up by user categoryouter ring 2011-2012, inner ring 2002-2012 ( ≥ 750 sqm lfa)12%10%21%1%45%60%17%23%15%2% 21%11%2%26%34%Breda andsurrounding area29%26%25%20%The NetherlandsAvailability by size categoryx 1,000 sqm ( ≥ 750 sqm lfa)8007006005004003002001000 2005 2006 2007 2008 2009 2010 2011 2012Industry Trade Transport IT Service-sector750-1,000 1,000-2,500 2,500-5,000 5,000-10,000 >10,00051
FACT SHEETS | JANUARY 2013Breda and surrounding areaBreda, Oosterhout, Moerdijk, Etten-Leur, Bergen op Zoom and RoosendaalOffice marketIndustrial marketTable of contentsIndustrial estates119BREDA ANDSURROUNDING AREAMoerdijkOosterhout1 Emer-South/Emer-North2 Heilaar North/IABC3 Krogten4 Hazeldonk123105 Hoogeind6 Steenakker7 Moleneind621758 VosdonkBreda9 Weststad I, II and III10 Vijfeiken11 Moerdijk8Etten-Leur412 Haagse BeemdenROOSENDAAL /BERGEN OP ZOOM1 Borchwerf I2 Borchwerf II3 Majoppeveld-North4 Majoppeveld-SouthA42A171Roosendaal3E3124A585 NoordlandA58E3125Bergen op ZoomA402 km© GeoMedia 2008 [7157]Large-scale transactions industrial space2012Town/City Location Tenant/Purchaser Floor spaceOosterhout Weststad Oosterhout Container Terminal bv 16,150Roosendaal Borchwerf I PostNL12,000Bergen op Zoom Noordland TNT Fashion Group bv10,450Breda Hazeldonk FMCG8,500Hazeldonk Biomet7,050Moerdijk Moerdijk A.M.S. Holding bv8,400Gross initial yieldsin %*2011 2012Region Location from to from toSouthBest locations7.50 9.50 7.75 9.75Other locations*excluding distribution centres8.75 11.00 9.00 11.50Rents for industrial spacein euro per sqm/year2011 2012Region Location from to from toBredaEmer-South/Emer-NorthHeilaar North/IABCKrogtenHazeldonkHoogeindSteenakkerMoleneindHaagse Beemden3040302540403025455050606060455025402525404025254050456060604040Etten-Leur Vosdonk25 50 25 50Oosterhout Weststad I, II en IIIVijfeiken4030604040306040Moerdijk Moerdijk30 55 30 55Roosendaal Majoppeveld/Borchwerf I en II 20 50 20 50Bergen op Zoom Noordland30 49 30 5052
FACT SHEETS | JANUARY 2013The Hague and surrounding areaThe Hague, Leiden, Rijswijk, Leidschendam-Voorburg, Lansingerland, Delft,Zoetermeer and GoudaOffice marketIndustrial marketTable of contentsOffice jobs145,3502011 vs. 20101.3%Availability316,000 sqm2012 vs. 201120%Stock1,244 ha2012 vs. 20111.7%Take-up83,000 sqm2012 vs. 201122%Availability (% of stock)5.1%2012 vs. 20111.3%Rents€ 50 per sqm/year2012 vs. 20111.4%Industry-sector jobs index2005=100Industrial estate stock(ha)1101,4001,20042361051,0008003024100600400181220069520052006200720082009201020110200520062007200820092010201120120The Hague and surrounding areaThe NetherlandsStockAnnual allocationSource: LISASource: VROM/DG Ruimte, edited by <strong>DTZ</strong> <strong>Zadelhoff</strong>Take-up and availabilityx 1,000 sqm ( ≥ 750 sqm lfa)42036030024018012060020052006 2007 2008 2009 2010 2011 2012Take-up Availability Average take-up 2005 - 2012Availability% of stock ( ≥ 750 sqm lfa)121086420The HagueDelft Rijswijk Zoetermeer Leiden Gouda LansingerlandVacancy 2011 Vacancy 2012 Dutch average 2012Take-up by user categoryouter ring 2011-2012, inner ring 2002-2012 ( ≥ 750 sqm lfa)16%15%22%29%2% 29% 21%2% 21%26%2%2%30%18% 17%26% 25%34%43%20%The Hague andsurrounding areaThe NetherlandsIndustry Trade Transport IT Service-sectorAvailability by size categoryx 1,000 sqm ( ≥ 750 sqm lfa)420360300240180120600 2005 2006 2007 2008 2009 2010 2011 2012750-1,000 1,000-2,500 2,500-5,000 5,000-10,000 >10,00053
FACT SHEETS | JANUARY 2013The Hague and surrounding areaThe Hague, Leiden, Rijswijk, Leidschendam-Voorburg, Lansingerland, Delft,Zoetermeer and GoudaOffice marketIndustrial marketTable of contentsIndustrial estates1 Kerketuinen/Zichtenburg2 Businesspark Prisma3 Lansinghage4 Binckhorst5 Laakhaven HS6 Ypenburg7 Forepark8 Plaspoelpolder9 Delft-NorthThe Hague54Leidschendam-Voorburg7Zoetermeer61 283Rijswijk9Large-scale transactions industrial space2012Town/City Location Tenant/Purchaser Floor spaceLeiden Zaalbergweg Infotheek Groep16,700Bleiswijk Prismalaan East Rexel Nederland7,700The Hague Forepark KONE6,250Berkel and Rodenrijs Braillestraat Breman4,100Bergschenhoek Oosteindsepad HAWE Systems3,900Rijswijk Plaspoelpolder Montrieurs3,800Zoetermeer Lansinghage Carepoly1,750Gross initial yieldsin %*2011 2012Region Location from to from toWest Best locations7.50 9.50 7.75 9.75Other locations*excluding distribution centres9.00 10.75 9.00 11.25Rents for industrial spacein euro per sqm/year2011 2012Region Location from to from toThe Hague Kerketuinen/ZichtenburgBinckhorstLaakhaven HSYpenburgForepark4030405555585860706740304053505857606867Zoetermeer Businesspark PrismaLansinghage5040656050406460RijswijkPlaspoelpolder25 50 25 50DelftDelft-North35 60 35 59GoudaGoudse Poort35 60 35 59Leiden40 60 39 59Leidschendam-VoorburgBleiswijk404560623845586254
FACT SHEETS | JANUARY 2013Ede and VeenendaalOffice marketIndustrial marketTable of contentsOffice jobs37,9502011 vs. 20101.2%Availability144,000 sqm2012 vs. 20110.7%Stock566 ha2012 vs. 20111.1%Take-up60,000 sqm2012 vs. 201121%Availability (% of stock)5.1%2012 vs. 20110.1%Rents€ 42 per sqm/year2012 vs. 20115.5%Industry-sector jobs index2005=10011010510095Industrial estate stock(ha)600500400300200100302520151059020052006200720082009201020110200520062007200820092010201120120Ede and VeenendaalThe NetherlandsStockAnnual allocationSource: LISASource: VROM/DG Ruimte, edited by <strong>DTZ</strong> <strong>Zadelhoff</strong>Take-up and availabilityx 1,000 sqm ( ≥ 750 sqm lfa)150120906030Availability% of stock ( ≥ 750 sqm lfa)12108642020052006 2007 2008 2009 2010 2011 20120EdeVeenendaalUtrechtAmersfoortArnhemNijmegenTake-up Availability Average take-up 2005 - 2012Vacancy 2011 Vacancy 2012 Dutch average 2012Take-up by user categoryouter ring 2011-2012, inner ring 2002-2012 ( ≥ 750 sqm lfa)6%15%29%24% 24%30% 40%2% 21%26%14%30%32%Ede and Veenendaal2%26%34%25%20%Industry Trade Transport IT Service-sectorThe NetherlandsAvailability by size categoryx 1,000 sqm ( ≥ 750 sqm lfa)15012090603002005 2006 2007 2008 2009 2010 2011 2012750-1,000 1,000-2,500 2,500-5,000 5,000-10,000 >10,00055
FACT SHEETS | JANUARY 2013Ede and VeenendaalOffice marketIndustrial marketTable of contentsIndustrial estates1 De Faktorij122 De Batterijen3 De Compagnie4 Het Ambacht5 Nijverkamp6 Kievitsmeent7 BT A128 Heestereng9 De Vallei10 Frankeneng21 3Veenendaal76891011Ede11 Klaphek12 Ede-North45Large-scale transactions industrial space2012Town/City Location Tenant/Purchaser Floor spaceEde De Vallei Toyota Material Handling NL 12,000Frankeneng JB Trading11,200Kievitsmeent Delinuts10,100Veenendaal Nijverkamp KT Logistics6,650De FaktorijHeijmans4,300De Batterijen Technetix3,000Rents for industrial spacein euro per sqm/year2011 2012Region Location from to from toEde KievitsmeentFrankeneng/KlaphekHeestereng/De ValleiBT A12Ede-North4530304035555555554545353040355050505545Veenendaal De Batterijen/Compagnie/FaktorijHet Ambacht/Nijverkamp4535555540305045Gross initial yieldsin %*2011 2012Region Location from to from toEast Best locationsOther locations8.509.5011.0011.509.009.7512.0012.50*excluding distribution centres56
FACT SHEETS | JANUARY 2013Eindhoven and surrounding areaEindhoven, Helmond, Best, Son en Breugel and VeldhovenOffice marketIndustrial marketTable of contentsOffice jobs101,5502011 vs. 20103.3%Availability513,000 sqm2012 vs. 201119%Stock1,602 ha2012 vs. 20111.5%Take-up196,000 sqm2012 vs. 2011109%Availability (% of stock)6.4%2012 vs. 20111.1%Rents€ 43 per sqm/year2012 vs. 20110.2%Industry-sector jobs index2005=10011010510095Industrial estate stock(ha)1,8001,5001,2009006003004235282114790 2005 2006 2007 2008 2009 2010 20110200520062007200820092010201120120Eindhoven and surrounding areaThe NetherlandsStockAnnual allocationSource: LISASource: VROM/DG Ruimte, edited by <strong>DTZ</strong> <strong>Zadelhoff</strong>Take-up and availabilityx 1,000 sqm ( ≥ 750 sqm lfa)Availability% of stock ( ≥ 750 sqm lfa)55012440103302208641102020052006 2007 2008 2009 2010 2011 20120EindhovenHelmondBestSon en BreugelVeldhovenTilburgTake-up Availability Average take-up 2005 - 2012Vacancy 2011 Vacancy 2012 Dutch average 2012Take-up by user categoryouter ring 2011-2012, inner ring 2002-2012 ( ≥ 750 sqm lfa)2%8%15%27%29%49% 28% 22%26% 25%14%34%20%20%28%2% 21%26%2%2%Eindhoven andsurrounding areaThe NetherlandsIndustry Trade Transport IT Service-sectorAvailability by size categoryx 1,000 sqm ( ≥ 750 sqm lfa)55044033022011002005 2006 2007 2008 2009 2010 2011 2012750-1,000 1,000-2,500 2,500-5,000 5,000-10,000 >10,00057
FACT SHEETS | JANUARY 2013Eindhoven and surrounding areaEindhoven, Helmond, Best, Son en Breugel and VeldhovenOffice marketIndustrial marketTable of contentsIndustrial estates1 De HurkSon en Breugel2 High Tech Campus3 De Run4 Lake Forum/Park Forum5 Flight Forum6 Eindhoven Airport7 Eindhoven/Acht8 Kapelbeemd9 Breeven10 Science Park Eindhoven11 Ekkersrijt12 Esp13 De Kade14 Groot Schooten15 Hoogeind/De Weijer6Best9054Veldhoven78110 1112Eindhoven1314Helmond151616 B.Z.O.B.32Large-scale transactions industrial space2012Town/City Location Tenant/Purchaser Floor spaceSon Ekkersrijt Rhenus Contract Logistics55,000Ekkersrijt IKEA8,000Eindhoven Eindhoven/Acht Van Rooijen Logistiek bv41,600Flight Forum DHL Supply Chain13,000Eindhoven Airport Versfelt Worldwide Verhuizingen 6,900Eindhoven/Acht TNT Express Nederland4,050Best Breeven B&G Productie bv3,700Gross initial yieldsin %*2011 2012Region Location from to from toSouth Best locations7.50 9.50 7.75 9.75Other locations*excluding distribution centres8.75 11.00 9.00 11.50Rents for industrial spacein euro per sqm/year2011 2012Region Location from to from toEindhoven De HurkEindhoven/AchtEspDe KadeKapelbeemdFlight Forum/Eindhoven AirportHigh Tech Campus40454035384040555547455055504045403538404052554745505550SonEkkersrijtScience Park Eindhoven3740505037405050Veldhoven De Run32 50 32 50Helmond B.Z.O.B.Groot SchootenHoogeindDe Weijer34393034504545453439303450454545BestBreeven34 45 34 4558
FACT SHEETS | JANUARY 2013FrieslandLeeuwarden, Heerenveen and DrachtenOffice marketIndustrial marketTable of contentsOffice jobs41,9002011 vs. 20101.5%Availability140,000 sqm2012 vs. 20114.3%Stock996 ha2012 vs. 20111.0%Take-up18,000 sqm2012 vs. 201145%Availability (% of stock)2.8%2012 vs. 20110.1%Rents€ 28 per sqm/year2012 vs. 20112.9%Industry-sector jobs index2005=10011010510095Industrial estate stock(ha)1,2001,0008006004002006050403020109020052006200720082009201020110200520062007200820092010201120120FrieslandThe NetherlandsStockAnnual allocationSource: LISASource: VROM/DG Ruimte, edited by <strong>DTZ</strong> <strong>Zadelhoff</strong>Take-up and availabilityx 1,000 sqm ( ≥ 750 sqm lfa)1601208040Availability% of stock ( ≥ 750 sqm lfa)54321020052006 2007 2008 2009 2010 2011 20120HeerenveenLeeuwarden-SmallingerlandGroningenAssenTake-up Availability Average take-up 2005 - 2012Vacancy 2011 Vacancy 2012 Dutch average 2012Take-up by user categoryouter ring 2011-2012, inner ring 2002-2012 ( ≥ 750 sqm lfa)Availability by size categoryx 1,000 sqm ( ≥ 750 sqm lfa)16031%34%24%13%14%28%54%2%Friesland2%15%2%21%26%34%29%26%25%20%The Netherlands120804002005 2006 2007 2008 2009 2010 2011 2012Industry Trade Transport IT Service-sector750-1,000 1,000-2,500 2,500-5,000 5,000-10,000 >10,00059
FACT SHEETS | JANUARY 2013FrieslandLeeuwarden, Heerenveen and DrachtenOffice marketIndustrial marketTable of contentsIndustrial estatesLEEUWARDEN1 De Hemrik13452 Newtonpark3 Business Park Leeuwarden4 Leeuwarden West3LeeuwardenHeerenveenDRACHTEN1 De Haven412 Burmania3 Azeven-South24 Azeven-North2HEERENVEEN1 Business Park Friesland West2 Heerenveen-South3 Business Park Friesland24 International Business parkFriesland5 De KavelsDrachten143Large-scale transactions industrial space2012Town/City Location Tenant/Purchaser Floor spaceHeerenveen Business park Friesland PostNL10,000Business Park Friesland De Beier Groep bv800Leeuwarden De HemrikNielsen-Massey Vanillas Int, LLC 3,000Drachten Azeven-South Bumba Kinderspeelparadijs 1,300Gross initial yieldsin %*2011 2012Region Location from to from toNorth Best locationsOther locations8.759.5011.5012.008.859.7512.0012.50*excluding distribution centresRents for industrial spacein euro per sqm/year2011 2012Region Location from to from toLeeuwarden De HemrikNewtonparkBusiness Park LeeuwardenLeeuwarden West20252525353535352025252535353535Drachten De HavenBurmaniaAzeven-SouthAzeven-North20303025354545402030252535454035Heerenveen Business Park Friesland WestHeerenveen-SouthBusiness Park Friesland252025353035202025353035Intern. Business park Friesland 25 35 25 35De Kavels25 35 20 35SneekDe Hemmen20 35 25 3060
FACT SHEETS | JANUARY 2013Gooi and EemlandAmersfoort and HilversumOffice marketIndustrial marketTable of contentsOffice jobs40,1502011 vs. 20100.5%Availability164,000 sqm2012 vs. 201129%Stock336 ha2012 vs. 20110.9%Take-up53,000 sqm2012 vs. 201172%Availability (% of stock)9.8%2012 vs. 20112.3%Rents€ 47 per sqm/year2012 vs. 20110.4%Industry-sector jobs index2005=100110105100Industrial estate stock(ha)450360270180901086429520052006200720082009201020110200520062007200820092010201120120Gooi and EemlandThe NetherlandsStockAnnual allocationSource: LISASource: VROM/DG Ruimte, edited by <strong>DTZ</strong> <strong>Zadelhoff</strong>Take-up and availabilityx 1,000 sqm ( ≥ 750 sqm lfa)2001601208040Availability% of stock ( ≥ 750 sqm lfa)12108642020052006 2007 2008 2009 2010 2011 20120AmersfoortHilversumZeistUtrechtAlmereTake-up Availability Average take-up 2005 - 2012Vacancy 2011 Vacancy 2012 Dutch average 2012Take-up by user categoryouter ring 2011-2012, inner ring 2002-2012 ( ≥ 750 sqm lfa)Availability by size categoryx 1,000 sqm ( ≥ 750 sqm lfa)20039%15%15%32%20% 8%2% 21%19%2%10%26%19%34%38%Gooi and Eemland29%26%25%20%The Netherlands160120804002005 2006 2007 2008 2009 2010 2011 2012Industry Trade Transport IT Service-sector750-1,000 1,000-2,500 2,500-5,000 5,000-10,000 >10,00061
FACT SHEETS | JANUARY 2013Gooi and EemlandAmersfoort and HilversumOffice marketIndustrial marketTable of contentsIndustrial estatesAMERSFOORT1 De Isselt2 De Wieken/Vinkenhoef3 Vathorst4 De Hoef5 Calveen53HILVERSUM1 Havenkwartier2 Kerkelanden1Amersfoort42Hilversum12Large-scale transactions industrial space2012Town/City Location Tenant/Purchaser Floor spaceHilversum Lage Naarderweg DutchView27,000Kerkelanden Heinen & Hopman1,200Amersfoort De Isselt Ruimte Direct6,600CalveenBabypark Amersfoort4,000Nijkerkerstraat Pon Leasing3,850De IsseltClassic Alfa bv1,050Gross initial yieldsin %*Rents for industrial spacein euro per sqm/year2011 2012Region Location from to from toAmersfoort De IsseltDe Wieken/VinkenhoefVathorstDe Hoef/Calveen25505035486562502250503548656250Hilversum HavenkwartierKerkelanden4540656545406565SoestZeist35405260354052602011 2012Region Location from to from toEast Best locationsOther locations8.509.5011.0011.509.009.7512.0012.50West Best locationsOther locations7.509.009.5010.757.759.009.7511.25*excluding distribution centresa62
FACT SHEETS | JANUARY 2013Groningen, Assen and EmmenOffice marketIndustrial marketTable of contentsOffice jobs67,8502011 vs. 20100.2%Availability164,000 sqm2012 vs. 201113%Stock1,631 ha2012 vs. 20110.5%Take-up9,000 sqm2012 vs. 201179%Availability (% of stock)2.0%2012 vs. 20110.3%Rents€ 38 per sqm/year2012 vs. 20118.0%Industry-sector jobs index2005=100Industrial estate stock(ha)110105100959020052006200720082009201020111,7001,6001,5001,4001,3001,2001,1001,00020052006200720082009201020112012706050403020100Groningen, Assen and EmmenThe NetherlandsStockAnnual allocationSource: LISASource: VROM/DG Ruimte, edited by <strong>DTZ</strong> <strong>Zadelhoff</strong>Take-up and availabilityx 1,000 sqm ( ≥ 750 sqm lfa)Availability% of stock ( ≥ 750 sqm lfa)21051801501204390603021020052006 2007 2008 2009 2010 2011 20120GroningenAssenEmmenZwolleLeeuwarden HeerenveenTake-up Availability Average take-up 2005 - 2012Vacancy 2011 Vacancy 2012 Dutch average 2012Take-up by user categoryouter ring 2011-2012, inner ring 2002-2012 ( ≥ 750 sqm lfa)15%24%30%29%33% 29%2% 21%26%2%2%20% 9% 26% 25%28%34%20%26% Groningen, Assenand EmmenThe NetherlandsIndustry Trade Transport IT Service-sectorAvailability by size categoryx 1,000 sqm ( ≥ 750 sqm lfa)2101801501209060300 2005 2006 2007 2008 2009 2010 2011 2012750-1,000 1,000-2,500 2,500-5,000 5,000-10,000 >10,00063
FACT SHEETS | JANUARY 2013Groningen, Assen and EmmenOffice marketIndustrial marketTable of contentsIndustrial estates3GRONINGEN1 EemspoortGroningen42 Euvelgunne/Winschoterdiep43 Hoendiep4 Driebond311ASSEN1 City business park2Assen2 Schepersmaat3 Messchenveld4 PeelerparkEMMEN21 Business park A372 Waanderveld3 BargermeerEmmen2 31Large-scale transactions industrial space2012Town/City Location Tenant/Purchaser Floor spaceAssen City business park Mammoet Nederland bv1,400Klazienaveen Business park A37 Private1,200Groningen Eemspoort Verfpunt bv1,050Eemspoort Luuk Belga Fietsen1,450Gross initial yieldsin %*2011 2012Region Location from to from toNorth Best locationsOther locations8.759.5011.5012.008.859.7512.0012.50*excluding distribution centresRents for industrial spacein euro per sqm/year2011 2012Region Location from to from toGroningen EemspoortEuvelgunne/WinschoterdiepHoendiepDriebond45302540504535454030254050403545AssenCity business parkScheepersmaatMesschenveldPeelerpark30354540404550453035403535404540Emmen Business park A37WaanderveldBargermeer40402045454535352040403564
FACT SHEETS | JANUARY 2013HaarlemmermeerHoofddorp, Schiphol, Nieuw-Vennep, Lijnden and CruquiusOffice marketIndustrial marketTable of contentsOffice jobs73,9502011 vs. 20100.5%Availability216,000 sqm2012 vs. 201119%Stock570 ha2012 vs. 20116.1%Take-up28,000 sqm2012 vs. 201174%Availability (% of stock)7.6%2012 vs. 20110.8%Rents€ 67 per sqm/year2012 vs. 20110.7%Industry-sector jobs index2005=100Industrial estate stock(ha)11060018105500151009590400300200100129638520052006200720082009201020110200520062007200820092010201120120HaarlemmermeerThe NetherlandsStockAnnual allocationSource: LISASource: VROM/DG Ruimte, edited by <strong>DTZ</strong> <strong>Zadelhoff</strong>Take-up and availabilityx 1,000 sqm ( ≥ 750 sqm lfa)25020015010050Availability% of stock ( ≥ 750 sqm lfa)20161284020052006 2007 2008 2009 2010 2011 20120HaarlemmermeerHaarlemAmsterdamDiemenLeidenTake-up Availability Average take-up 2005 - 2012Vacancy 2011 Vacancy 2012 Dutch average 2012Take-up by user categoryouter ring 2011-2012, inner ring 2002-2012 ( ≥ 750 sqm lfa)Availability by size categoryx 1,000 sqm ( ≥ 750 sqm lfa)25034%15%6% 13%6%18%31% 52% 11%14%Haarlemmermeer15%2% 21%2%26%34%29%26%25%20%The Netherlands2001501005002005 2006 2007 2008 2009 2010 2011 2012Industry Trade Transport IT Service-sector750-1,000 1,000-2,500 2,500-5,000 5,000-10,000 >10,00065
FACT SHEETS | JANUARY 2013HaarlemmermeerHoofddorp, Schiphol, Nieuw-Vennep, Lijnden and CruquiusOffice marketIndustrial marketTable of contentsIndustrial estates1 De Hoek/Schiphol-West2 Graan voor Visch3 De PresidentCruquius1312LijndenBadhoevedorp4 North5 Schiphol-North6 Schiphol-Rijk57 Schiphol-South8 Schiphol-South East4Schiphol9 Spoorzicht10 Pionier11 Nieuw-Vennep-South12 ABP Lijnden13 Cruquius-South14 Schiphol Logistics Park15 Oude MeerHoofddorp321768151410Nieuw-Vennep911Large-scale transactions industrial space2012Town/City Location Tenant/Purchaser Floor spaceOude Meer Fokkerweg Recon4,100Lijnden ABP Lijnden World of Delights3,100Schiphol-Rijk Schiphol-Rijk SGS Nederland bv2,550Hoofddorp Graan voor Visch Salto2,300Schiphol Schiphol-South Copex Air bv2,000Schiphol-South Veleka Logistics bv1,500Nieuw-Vennep Nieuw-Vennep-South Network4cars bv1,900Gross initial yieldsin %*2011 2012Region Location from to from toWest Best locations7.50 9.50 7.75 9.75Other locations*excluding distribution centres9.00 10.75 9.00 11.25Rents for industrial spacein euro per sqm/year2011 2012Region Location from to from toHoofddorp De Hoek/Schiphol-WestGraan voor VischDe PresidentNorth60556540856575606055654085657560Schiphol Schiphol-NorthSchiphol-South7065808570608080Schiphol-South EastSchiphol-RijkSchiphol Logistics ParkOude Meer7565757011085909078657570110858588Nieuw-Vennep SpoorzichtPionierNieuw-Vennep-South453560655075453560655075LijndenAirport Business Park 70 80 70 80Cruquius Cruquius-South50 65 50 6566
FACT SHEETS | JANUARY 2013’s-Hertogenbosch, Tilburgand WaalwijkOffice marketIndustrial marketTable of contentsOffice jobs98,0502011 vs. 20100.3%Availability603,000 sqm2012 vs. 201114%Stock1,769 ha2012 vs. 20110.6%Take-up282,000 sqm2012 vs. 201156%Availability (% of stock)6.8%2012 vs. 20110.8%Rents€ 40 per sqm/year2012 vs. 20112.0%Industry-sector jobs index2005=100115Industrial estate stock(ha)1,80060110105100951,500 501,200409003060020300109020052006200720082009201020110200520062007200820092010201120120’s-Hertogenbosch, Tilburg and WaalwijkThe NetherlandsStockAnnual allocationSource: LISASource: VROM/DG Ruimte, edited by <strong>DTZ</strong> <strong>Zadelhoff</strong>Take-up and availabilityx 1,000 sqm ( ≥ 750 sqm lfa)Availability% of stock ( ≥ 750 sqm lfa)63056049042037028021014070020052006 2007 2008 2009 2010 2011 2012129630’s-Hertogenbosch TilburgWaalwijkBredaOosterhoutEindhovenTake-up Availability Average take-up 2005 - 2012Vacancy 2011 Vacancy 2012 Dutch average 2012Take-up by user categoryouter ring 2011-2012, inner ring 2002-2012 ( ≥ 750 sqm lfa)4%3%11%2%51%56%27%21%15%10%’s-Hertogenbosch,Tilburg and Waalwijk15%29%2%2%21%26%2%26% 25%34%20%Industry Trade Transport IT Service-sectorThe NetherlandsAvailability by size categoryx 1,000 sqm ( ≥ 750 sqm lfa)630560490420350280210140700 2005 2006 2007 2008 2009 2010 2011 2012750-1,000 1,000-2,500 2,500-5,000 5,000-10,000 >10,00067
FACT SHEETS | JANUARY 2013’s-Hertogenbosch, Tilburgand WaalwijkOffice marketIndustrial marketTable of contentsIndustrial estates’S-HERTOGENBOSCH1 De Vutter32 De Rietvelden3 Maaspoort14 De Brand5 De Herven3Tilburg2TILBURG1 Kraaiven2 Loven1253 Vossenberg4 Katsbogten’s-Hertogenbosch44Large-scale transactions industrial space2012Town/City Location Tenant/Purchaser Floor spaceTilburg Vossenberg Ingram Micro23,400Katsbogten Bakker Logistiek20,300Vossenberg Tesla Sportcar Benelux18,950Vossenberg Syncreon15,850Vossenberg Gebr. Versteijnen Transport & Logistics 14,450Waalwijk Haven Zeven Mc Gregor15,000Elzenweg Int. company in tyres12,450Haven Zeven Van Haren Schoenen12,000Gross initial yieldsin %*Rents for industrial spacein euro per sqm/year2011 2012Region Location from to from toOss/Uden/Veghel30 45 30 48‘s-Hertogenbosch De BrandDe HervenDe Rietvelden404030504545403830484545TilburgKatsbogtenKraaivenLovenVossenberg40303035484845484030303545454548Waalwijk35 55 30 522011 2012Region Location from to from toSouthBest locations7.50 9.50 7.75 9.75Other locations*excluding distribution centres8.75 11.00 9.00 11.5068
FACT SHEETS | JANUARY 2013LimburgVenlo, Sittard-Geleen and VenrayOffice marketIndustrial marketTable of contentsOffice jobs68,6502011 vs. 20100.3%Availability326,000 sqm2012 vs. 201124%Stock1,877 ha2012 vs. 20111.1%Take-up256,000 sqm2012 vs. 201197%Availability (% of stock)3.5%2012 vs. 20111.1%Rents€ 37 per sqm/year2012 vs. 20110%Industry-sector jobs index2005=10010510095Industrial estate stock(ha)2,0001,8001,6001,4001,20075604530159020052006200720082009201020111,000200520062007200820092010201120120LimburgThe NetherlandsStockAnnual allocationSource: LISASource: VROM/DG Ruimte, edited by <strong>DTZ</strong> <strong>Zadelhoff</strong>Take-up and availabilityx 1,000 sqm ( ≥ 750 sqm lfa)Availability% of stock ( ≥ 750 sqm lfa)54048042036030024018012060020052006 2007 2008 2009 2010 2011 20121086420VenloSittard-GeleenVenrayMaastrichtRoermondEindhovenTake-up Availability Average take-up 2005 - 2012Vacancy 2011 Vacancy 2012 Dutch average 2012Take-up by user categoryouter ring 2011-2012, inner ring 2002-2012 ( ≥ 750 sqm lfa)1%7%6%4%17%27%23%50%65%Limburg15%2% 21%2%26%34%29%26%25%20%The NetherlandsAvailability by size categoryx 1,000 sqm ( ≥ 750 sqm lfa)540480420360300240180120600 2005 2006 2007 2008 2009 2010 2011 2012Industry Trade Transport IT Service-sector750-1,000 1,000-2,500 2,500-5,000 5,000-10,000 >10,00069
FACT SHEETS | JANUARY 2013LimburgVenlo, Sittard-Geleen and VenrayOffice marketIndustrial marketTable of contentsIndustrial estatesVENRAYA7311 Smakterheide2 Keizersveld3 De Hulst4 De BlaktVENLO1 Trade Port2 Trade Port West3 Trade Port North4 Geloërveld (Belfeld)5 Veegtes23A73E34 A67Born51 2E25A2VenloSittardSITTARD-GELEEN-BORN1 Holtum-North2 Business park North3 Business city FortunaTegelen3A7340 2 kmGeleen01 kmA7312Venray3Large-scale transactions industrial space2012A7340 1 kmTown/City Location Tenant/Purchaser Floor spaceVenlo Trade Port West Brand Loyalty41,650Trade Port West Tommy Hilfiger Europe bv 17,400Trade PortArrow Electronics DLC15,000Venray De Blakt Microsoft40,000De BlaktCEVA38,500Born Holtum-North CEVA15,750Sittard Business park North Eurocarbon11,050Gross initial yieldsin %*2011 2012Region Location from to from toSouth Best locations7.50 9.50 7.75 9.75Other locations*excluding distribution centres8.75 11.00 9.00 11.50Rents for industrial spacein euro per sqm/year2011 2012Region Location from to from toVenraySmakterheideKeizersveldDe Hulst/De Blakt333330484545333330484545VenloTrade PortTrade Port West and NorthGeloërveld (Belfeld)Veegtes35373729484943383537372948494338BornHoltum-North25 50 25 50SittardBusiness park NorthBusiness city Fortuna2538414525384145Heerlen De KoumenDe Locht/De BeitelIn de Cramer292929394141292929394141Maastricht BeatrixhavenMaastricht Airport3240484832404848Roermond RoerstreekWillem Alexander292941392929413970
FACT SHEETS | JANUARY 2013Rotterdam and surrounding areaRotterdam, Capelle a/d IJssel, Schiedam, Spijkenisse, Barendrecht,Ridderkerk, Vlaardingen, Oud-Beijerland and DrechtstedenOffice marketIndustrial marketTable of contentsOffice jobs254,4002011 vs. 20100.1%Availability577,000 sqm2012 vs. 20110.7%Stock2,420 ha2012 vs. 20110.3%Take-up287,000 m 22012 vs. 20110.9%Availability (% of stock)4.8%2012 vs. 20110%Rents€ 51 per sqm/year2012 vs. 20110.7%Industry-sector jobs index2005=10011010510095Industrial estate stock(ha)2,5002,0001,5001,00050050403020109020052006200720082009201020110200520062007200820092010201120120Rotterdam and surrounding areaThe NetherlandsStockAnnual allocationSource: LISASource: VROM/DG Ruimte, edited by <strong>DTZ</strong> <strong>Zadelhoff</strong>Take-up and availabilityx 1,000 sqm ( ≥ 750 sqm lfa)800700600500400300200100020052006 2007 2008 2009 2010 2011 2012Take-up Availability Average take-up 2005 - 2012Availability% of stock ( ≥ 750 sqm lfa)121086420Rotterdam*Capellea/d IJsselDrechtstedenSchiedamVacancy 2011 Vacancy 2012 Dutch average 2012* Including stock distriparken Maasvlakte, Botlek and EemhavenBredaThe HagueTake-up by user categoryouter ring 2011-2012, inner ring 2002-2012 ( ≥ 750 sqm lfa)21%19%1%35%37%24%31%2%15%21%2%21%26%11%34%Rotterdam andsurrounding area29%26%25%20%The NetherlandsAvailability by size categoryx 1,000 sqm ( ≥ 750 sqm lfa)8007006005004003002001000 2005 2006 2007 2008 2009 2010 2011 2012Industry Trade Transport IT Service-sector750-1,000 1,000-2,500 2,500-5,000 5,000-10,000 >10,00071
FACT SHEETS | JANUARY 2013Rotterdam and surrounding areaRotterdam, Capelle a/d IJssel, Schiedam, Spijkenisse, Barendrecht,Ridderkerk, Vlaardingen, Oud-Beijerland and DrechtstedenOffice marketIndustrial marketTable of contentsIndustrial estates71 Distripark Botlek2 Distripark Maasvlakte3 Europoort4 Distripark Eemhaven5 Waalhavengebied1060Capelle a/d IJssel6 Northwest/Spaanse Polder7 HoofdweggebiedSchiedam8 Drechtsteden9 Vijfsluizen910 ’s-Graveland11 Spijkenisse12 Nieuwe Gadering1 23Rotterdam5124118Large-scale transactions industrial space2012Town/City Location Tenant/Purchaser Floor spaceRotterdam Galileistraat Commodity business 52,000Botlek Rotterdam Nieuwesluisweg Commodity business 12,900Rotterdam-Albrandswaard Distripark Eemhaven Commodity business 12,450Abel Tasmanstraat Commodity business 6,200Distripark Eemhaven Pantos Logistics5,100Schiedam Vijfsluizen IPS Trade6,850Gross initial yieldsin %*2011 2012Region Location from to from toWestBest locations 7.50 9.50 7.75 9.75Other locations 9.00 10.75 9.00 11.25*excluding distribution centresRents for industrial spacein euro per sqm/year2011 2012Region Location from to from toRotterdam Distripark BotlekDistripark MaasvlakteDistripark EemhavenWaalhavengebiedNorthwest/Spaanse PolderNieuwe Gadering403548434845555058606155403548434845555058596055Spijkenisse Halfweg45 55 45 55Capelle a/d IJssel Hoofdweggebied52 62 51 60Schiedam Vijfsluizen‘s-Graveland5445595853455856Barendrecht Dierenstein/Vaanpark 51 61 50 61Ridderkerk Donkersloot48 59 48 57VlaardingenOud-Beijerland414555534545535372
FACT SHEETS | JANUARY 2013TwenteEnschede, Hengelo, Almelo and OldenzaalOffice marketIndustrial marketTable of contentsOffice jobs82,4502011 vs. 20102.2%Availability302,000 sqm2012 vs. 201130%Stock1,640 ha2012 vs. 20111.0%Take-up95,000 sqm2012 vs. 20114.7%Availability (% of stock)3.7%2012 vs. 20111.5%Rents€ 35 per sqm/year2012 vs. 20112.6%Industry-sector jobs index2005=100110105100Industrial estate stock(ha)2,0001,6001,20080040050403020109520052006200720082009201020110200520062007200820092010201120120TwenteThe NetherlandsStockAnnual allocationSource: LISASource: VROM/DG Ruimte, edited by <strong>DTZ</strong> <strong>Zadelhoff</strong>Take-up and availabilityx 1,000 sqm ( ≥ 750 sqm lfa)Availability% of stock ( ≥ 750 sqm lfa)45040035030025020015010050020052006 2007 2008 2009 2010 2011 20121086420EnschedeHengeloAlmeloOldenzaalDeventerZwolleTake-up Availability Average take-up 2005 - 2012Vacancy 2011 Vacancy 2012 Dutch average 2012Take-up by user categoryouter ring 2011-2012, inner ring 2002-2012 ( ≥ 750 sqm lfa)10%1%13%37%1% 34%26%42%26%10%Twente2%15%21%2%26%34%29%26%25%20%The NetherlandsAvailability by size categoryx 1,000 sqm ( ≥ 750 sqm lfa)4504003503002502001501005002005 2006 2007 2008 2009 2010 2011 2012Industry Trade Transport IT Service-sector750-1,000 1,000-2,500 2,500-5,000 5,000-10,000 >10,00073
FACT SHEETS | JANUARY 2013TwenteEnschede, Hengelo, Almelo and OldenzaalOffice marketIndustrial marketTable of contentsIndustrial estates1 Harbor2 Marssteden3 Euregio Business park784 Josink-Es5 Twentekanaal6 Westermaat7 Business park Twente8 Dollegoor/TurfkadeAlmelo1011A359Oldenzaal9 Business park Bornsestraat10 Twentepoort11 XL Business park Twente12 HazewinkelE30A16Hengelo1213E30A113 Hanzepoort5A35214Enschede30 4 km© GeoMedia 2008 [7157]Large-scale transactions industrial space2012Town/City Location Tenant/Purchaser Floor spaceEnschede Marssteden Apollo Vredestein bv22,050HarborDe Brink6,900MarsstedenPentair X-Flow5,600Almelo Business park Twente Logistics company7,100Oldenzaal Hanzepoort TNT Fashion Group4,150HazewinkelDe Zuivelhoeve3,650Gross initial yieldsin %*2011 2012Region Location from to from toEast Best locationsOther locations8.509.5011.0011.509.009.7512.0012.50*excluding distribution centresRents for industrial spacein euro per sqm/year2011 2012Region Location from to from toEnschede De HavenEuregio Business parkMarsstedenJosink-Es25253040354245502025303835424550AlmeloBusiness park BornsestraatBusiness park TwenteDollegoor/TurfkadeTwentepoortXL Business park Twente3225253540434035455032252032404335354050Hengelo TwentekanaalWestermaat3035454530354545Oldenzaal HanzepoortHazewinkel323042453230424574
FACT SHEETS | JANUARY 2013Utrecht and surrounding areaUtrecht, Stichtse Vecht, Nieuwegein and HoutenOffice marketIndustrial marketTable of contentsOffice jobs90,1002011 vs. 20100.4%Availability352,000 sqm2012 vs. 201162%Stock715 ha2012 vs. 20110.7%Take-up64,000 sqm2012 vs. 201159%Availability (% of stock)9.8%2012 vs. 20113.7%Rents€ 45 per sqm/year2012 vs. 20110.5%Industry-sector jobs index2005=100Industrial estate stock(ha)110105100959020052006200720082009201020118007006005004003002001000200520062007200820092010201120124035302520151050Utrecht and surrounding areaThe NetherlandsStockAnnual allocationSource: LISASource: VROM/DG Ruimte, edited by <strong>DTZ</strong> <strong>Zadelhoff</strong>Take-up and availabilityx 1,000 sqm ( ≥ 750 sqm lfa)Availability% of stock ( ≥ 750 sqm lfa)360153001224018012060963020052006 2007 2008 2009 2010 2011 20120UtrechtStichtse VechtNieuwegeinHoutenZeistWoerdenTake-up Availability Average take-up 2005 - 2012Vacancy 2011 Vacancy 2012 Dutch average 2012Take-up by user categoryouter ring 2011-2012, inner ring 2002-2012 ( ≥ 750 sqm lfa)Availability by size categoryx 1,000 sqm ( ≥ 750 sqm lfa)36017%23%15%26% 20%29%26%27% 21%2% 21%3%2%34%34%Utrecht andsurrounding area29%26%25%20%The Netherlands3002401801206002005 2006 2007 2008 2009 2010 2011 2012Industry Trade Transport IT Service-sector750-1,000 1,000-2,500 2,500-5,000 5,000-10,000 >10,00075
FACT SHEETS | JANUARY 2013Utrecht and surrounding areaUtrecht, Stichtse Vecht, Nieuwegein and HoutenOffice marketIndustrial marketTable of contentsIndustrial estates1 Lage Weide2 Oudenrijn (De Meern)3 Overvecht-NorthStichtse Vecht134 De Wetering5 Plettenburg/De Wiers6 Liesbosch/Laagraven4Utrecht7 ’t Klooster8 Doornkade9 Rondeel10 Meerpaal26Nieuwegein8579Houten10Large-scale transactions industrial space2012Town/City Location Tenant/Purchaser Floor spaceUtrecht Groenewoudsedijk Utrechtse Bazaar11,350Lage Weide Schenker High Tech Logistics bv 5,650GageldijkPrivate4,000Lage Weide Rijver bv3,950De Wetering Apac2,850Cartesiusweg Meubel XL bv2,450Breukelen Corridor Lease Plan Occasions3,450Gross initial yieldsin %*2011 2012Region Location from to from toWest Best locations7.50 9.50 7.75 9.75Other locations*excluding distribution centres9.00 10.75 9.00 11.25Rents for industrial spacein euro per sqm/year2011 2012Region Location from to from toUtrecht Lage WeideOudenrijn (De Meern)Overvecht-NorthDe Wetering30303048655549603030304565554960Nieuwegein Plettenburg/De WiersLiesbosch/Laagraven‘t Klooster353550505565353550505565HoutenDoornkadeRondeelMeerpaal354248485358354048485358MaarssenVianenDe Hagen303050453030504576
FACT SHEETS | JANUARY 2013Zwolle, Apeldoorn and DeventerOffice marketIndustrial marketTable of contentsOffice jobs78,7002011 vs. 20101.4%Availability236,000 sqm2012 vs. 201111%Stock1,268 ha2012 vs. 20111.3%Take-up89,000 sqm2012 vs. 201110%Availability (% of stock)3.7%2012 vs. 20110.4%Rents€ 42 per sqm/year2012 vs. 20113.6%Industry-sector jobs index2005=10011010510095Industrial estate stock(ha)1,5001,20090060030050403020109020052006200720082009201020110200520062007200820092010201120120Zwolle, Apeldoorn and DeventerThe NetherlandsStockAnnual allocationSource: LISASource: VROM/DG Ruimte, edited by <strong>DTZ</strong> <strong>Zadelhoff</strong>Take-up and availabilityx 1,000 sqm ( ≥ 750 sqm lfa)Availability% of stock ( ≥ 750 sqm lfa)35010300250200861501005042020052006 2007 2008 2009 2010 2011 20120ZwolleApeldoornDeventerAssenHeerenveenTake-up Availability Average take-up 2005 - 2012Vacancy 2011 Vacancy 2012 Dutch average 2012Take-up by user categoryouter ring 2011-2012, inner ring 2002-2012 ( ≥ 750 sqm lfa)19%25%1%30%43%19%20%25% 18%Zwolle, Apeldoornand Deventer2%15%21%2%26%34%29%26%25%20%The NetherlandsAvailability by size categoryx 1,000 sqm ( ≥ 750 sqm lfa)350300250200150100500 2005 2006 2007 2008 2009 2010 2011 2012Industry Trade Transport IT Service-sector750-1,000 1,000-2,500 2,500-5,000 5,000-10,000 >10,00077
FACT SHEETS | JANUARY 2013Zwolle, Apeldoorn and DeventerOffice marketIndustrial marketTable of contentsIndustrial estatesZWOLLE1 Marslanden3Deventer2 Voorst3 Hessenpoort4 De VrolijkheidDEVENTER2Zwolle41231 Bergweide2 Kloosterlanden/Hanzepark3 De Wetering1APELDOORN1 Stadhoudersmolen2 Apeldoorn-North123 De Vlijt4 Kaijersmolen35 Kuipersveld6 Malkenschoten7 Brouwersmolen8 Ecofactorij7Apeldoorn4856Large-scale transactions industrial space2012Town/City Location Tenant/Purchaser Floor spaceDeventer Kloosterlanden TNT16,000KloosterlandenBosgoed5,800KloosterlandenCirculus bv3,100Zwolle Hessenpoort Scania Production Zwolle bv 8,550WillemsvaartTenneT TSO bv3,000Apeldoorn Stadhoudersmolen Industr. and construction company 3,700Gross initial yieldsin %*2011 2012Region Location from to from toNorth Best locationsOther locations8.759.5011.5012.008.859.7512.0012.50East Best locationsOther locations8.509.5011.0011.509.009.7512.0012.50*excluding distribution centresRents for industrial spacein euro per sqm/year2011 2012Region Location from to from toApeldoorn StadhoudersmolenDe VlijtKaijersmolenKuipersveldMalkenschotenBrouwersmolen253535354035505050505565253520304035505035455555Deventer Kloosterlanden/HanzeparkBergweideDe Wetering253030505550303030555550ZwolleHessenpoortDe VrolijkheidMarslandenVoorst4525353060505055403535305550505578
FACT SHEETS | JANUARY 2013Real estate dataOffice marketIndustrial marketTable of contentsMunicipalityTake-up(in sqm)Availability(in sqm)Availability(% of stock)Stock(in ha)Range of rents(in euro per sqm/year)Almelo 16,000 42,000 2% 494 20-50Almere 49,000 256,000 11% 489 30-65Amersfoort 22,000 136,000 11% 249 22-65Amstelveen 5,000 15,000 11% 26 45-55Amsterdam 115,000 462,000 12% 771 37-70Apeldoorn 25,000 66,000 2% 560 20-55Arnhem 16,000 48,000 4% 236 30-65Assen 2,000 30,000 2% 250 30-45Barendrecht 4,000 8,000 1% 153 50-61Bergen op Zoom 15,000 35,000 1% 476 30-50Best 14,000 44,000 6% 155 34-45Breda 67,000 255,000 7% 763 25-60Capelle aan den IJssel 8,000 40,000 6% 129 51-60Delft 3,000 20,000 2% 194 35-59Deventer 39,000 79,000 5% 290 30-55Diemen 3,000 30,000 12% 52 35-50Drechtsteden 28,000 166,000 4% 891 50-61Duiven 18,000 36,000 4% 195 25-45Ede 42,000 109,000 7% 314 30-55Eindhoven 94,000 292,000 9% 644 35-55Emmen 2,000 73,000 2% 724 20-40Enschede 53,000 123,000 5% 504 20-50Etten-Leur 9,000 92,000 6% 296 25-40Gouda 2,000 17,000 3% 136 35-59Groningen 5,000 61,000 2% 657 25-50Haarlemmermeer 28,000 216,000 8% 570 35-110Heerenveen 12,000 25,000 2% 289 20-35Helmond 9,000 71,000 3% 503 30-50Hengelo 12,000 66,000 3% 463 30-45Hilversum 31,000 28,000 6% 87 40-65Houten 1,000 21,000 6% 69 35-58Leeuwarden 3,000 69,000 4% 381 20-35Lansingerland 28,000 69,000 7% 207 45-62Leiden 18,000 20,000 4% 103 39-59Moerdijk 13,000 120,000 13% 185 30-55Nieuwegein 5,000 93,000 9% 200 35-65Nijmegen 11,000 73,000 3% 514 25-50Oldenzaal 14,000 70,000 8% 180 30-45Oosterhout 29,000 84,000 3% 550 30-60Oud-Beijerland 0 7,000 1% 99 45-53Ridderkerk 28,000 40,000 6% 143 48-57Rijswijk 8,000 21,000 5% 92 25-50Roosendaal 56,000 113,000 7% 335 20-50Rotterdam 176,000 260,000 7% 533 35-60Schiedam 22,000 39,000 8% 96 45-58's-Hertogenbosch 57,000 166,000 7% 503 30-48Sittard-Geleen 57,000 63,000 2% 782 25-50Smallingerland 3,000 45,000 3% 326 20-45Son en Breugel 75,000 42,000 4% 186 37-50Spijkenisse 18,000 9,000 2% 89 45-55Stichtse Vecht 8,000 27,000 8% 61 30-50Tilburg 158,000 363,000 8% 874 30-45The Hague 9,000 86,000 5% 314 30-68Utrecht 50,000 211,000 11% 384 30-65Veenendaal 18,000 35,000 3% 252 30-50Veldhoven 4,000 64,000 11% 114 32-50Venlo 101,000 159,000 4% 785 29-49Venray 98,000 104,000 7% 311 30-48Vlaardingen 2,000 9,000 1% 122 45-53Waalwijk 67,000 74,000 4% 392 30-52Wijchen 49,000 65,000 8% 159 40-50Zevenaar 0 17,000 3% 102 25-40Zoetermeer 15,000 84,000 9% 182 40-64Zwolle 25,000 92,000 4% 418 30-55The Netherlands 2,760,000 9,274,000 3.5% 52,316 20-11079
FACT SHEETS | JANUARY 2013General dataOffice marketIndustrial marketTable of contentsMunicipalityInhabitants(in numbers)Labour force(in % of totalpopulation)Private disposablehousehold income(in euros)Stock of businessspace perinhabitant(in sqm/inhabitant)Office jobs(in numbers)Almelo 72,750 66% 30,600 34.0 19,050Almere 193,150 71% 35,000 12.7 29,500Amersfoort 148,250 67% 36,800 8.4 26,750Amstelveen 83,350 65% 39,700 1.6 12,250Amsterdam 790,100 73% 30,700 4.9 122,900Apeldoorn 156,950 66% 34,700 17.8 30,700Arnhem 149,250 71% 30,200 7.9 27,250Assen 67,200 66% 31,900 18.6 11,400Barendrecht 47,050 66% 41,200 16.2 11,500Bergen op Zoom 66,150 67% 33,300 35.9 14,550Best 28,700 66% 38,300 27.0 9,100Breda 176,400 67% 35,000 21.6 37,600Capelle aan den IJssel 66,100 68% 35,200 9.7 13,950Delft 98,700 73% 32,200 9.8 15,250Deventer 98,650 67% 32,200 14.7 19,200Diemen 24,950 70% 35,400 10.4 6,700Drechtsteden 267,350 66% 34,000 16.7 58,700Duiven 25,550 67% 36,100 38.1 8,800Ede 108,750 65% 36,500 14.5 22,600Eindhoven 217,250 69% 31,700 14.8 49,000Emmen 108,850 65% 30,500 34.8 22,100Enschede 158,050 69% 29,300 16.0 30,100Etten-Leur 42,050 67% 35,500 35.2 10,900Gouda 71,250 67% 34,900 9.5 11,400Groningen 193,150 76% 28,700 17.0 34,350Haarlemmermeer 143,950 68% 39,400 19.8 73,950Heerenveen 43,500 64% 32,400 33.2 10,600Helmond 88,800 67% 32,200 28.3 21,850Hengelo 80,950 65% 31,800 28.6 22,500Hilversum 85,550 65% 36,300 5.1 13,400Houten 48,300 68% 42,400 7.2 8,950Leeuwarden 95,300 70% 29,000 20.0 16,700Lansingerland 55,250 65% 42,200 18.7 8,750Leiden 118,750 73% 34,100 4.4 17,250Moerdijk 36,500 66% 36,800 25.4 14,100Nieuwegein 60,700 70% 35,600 16.5 17,250Nijmegen 165,200 72% 30,600 15.6 29,900Oldenzaal 32,200 64% 33,500 27.9 10,800Oosterhout 54,000 66% 36,000 50.9 14,700Oud-Beijerland 23,400 66% 39,200 21.2 5,600Ridderkerk 45,200 65% 34,600 15.8 11,350Rijswijk 47,000 65% 33,100 9.8 7,850Roosendaal 77,450 66% 33,700 21.6 18,850Rotterdam 616,250 69% 29,500 4.3 122,300Schiedam 76,250 68% 31,000 6.3 13,400's-Hertogenbosch 141,900 69% 34,400 17.7 37,950Sittard-Geleen 94,550 66% 31,400 41.3 24,250Smallingerland 55,450 64% 30,900 29.4 14,600Son en Breugel 15,800 60% 41,300 58.8 7,950Spijkenisse 72,150 70% 34,100 6.2 7,700Stichtse Vecht 63,300 67% 40,200 4.8 10,150Tilburg 207,600 70% 31,500 21.1 43,550The Hague 502,050 70% 31,600 3.1 60,900Utrecht 316,300 73% 34,100 6.1 53,700Veenendaal 62,850 66% 34,800 20.0 15,350Veldhoven 43,900 66% 36,400 13.0 13,600Venlo 100,050 67% 31,100 39.2 31,250Venray 42,950 67% 34,700 36.1 13,150Vlaardingen 71,050 66% 31,600 8.6 9,900Waalwijk 46,400 66% 34,700 42.2 16,550Wijchen 40,750 66% 35,700 19.5 9,150Zevenaar 32,450 65% 33,300 15.7 6,150Zoetermeer 122,350 70% 36,200 7.4 16,900Zwolle 121,550 68% 33,200 17.2 28,800The Netherlands 16,730,350 67% 34,200 15.6 3,202,40080
FACT SHEETS | JANUARY 2013Definitions, sourcesand basis of the surveyTable of contentsThe factsheets present a number of propertyindicators in the form of charts and tables.The following is a brief explanation ofdefinitions and sources to accompany theindicators used, as well as an explanation ofthe basis of the survey.Index of Office jobs/industry-sector jobsThe chart entitled Index of Office jobs / Jobsin industry shows the indexed development inthe number of jobs, using the year 2005 asbase. The source of the data is LISA database.Take-up and availabilityThe chart entitled Take-up and availabilityshows the historical development of thetake-up and availability of office or industrialspace between the years 2005 and 2012.Take-up refers to office or industrial spacesold and let on the ‘open market’, butexcluding premises covered by sale-andleasebacktransactions and new premisesbuilt for owner-occupiers. Transactions arerecorded as of the date on which agreementis reached between the parties concerned,with a lower size limit of 500 sqm for officespace and 750 sqm for industrial space.Availability refers to premises which, at theend of each calendar year, have at least500 sqm of office space or 750 sqm ofindustrial space (including the associatedoffice space), for sale or letting. Availablespace relates solely to premises that havealready been completed and those underconstruction, and specifically excludesdevelopments still in the planning stage. Thesource of the data is <strong>DTZ</strong> <strong>Zadelhoff</strong>.Stock/Stock in use (offices)For the office property market stock refers tothe total existing office space and office spaceunder construction with a surface area of 500sqm lettable floor area or more. The officeproperty stock figures are supplied by Bakand per January 2012. Stock in use or officestock in use refers to all offices where a useris accommodated. This concerns acombination of data from Bak and <strong>DTZ</strong><strong>Zadelhoff</strong>.Distribution centreA large-scale business space in which logisticoperations (or a wide range thereof) arecarried out, such as storage, transhipment,groupage, etcetera.Industrial estate stockThe chart entitled Industrial estate stockindicates both the stock of allocated industrialestate in terms of ha of land intended forindustrial use, and the annual allocation ofindustrial estate (also in ha). The source of thedata is VROM/DG Ruimte.Vacant space (offices)Vacant space refers to space on offer incompleted buildings, which is not or no longerin use at the time of the survey. Vacant spaceis expressed as a percentage of the officestock at the end of the year.Availability-stock ratio(industrial property)The availability-stock ratio expresses therelationship between availability and stock inpercentages. The stock of industrial premises(in sqm) is calculated by reducing the stock ofbusiness parks by a plot ratio (permissiblebuilding area) of 50%.Gross initial yieldGross initial yield refers to the gross rentalincome before depreciation, amortisation andowner’s property charges, as a percentage ofthe total acquisition price with purchasingcosts payable by the vendor. The basis forinitial yields for offices and business spaces isa 10-year contract with solvent users.IncentivesIncentives are reductions agreed betweenthe tenant and the lessor when concluding orextending a lease. For high-quality propertyincentives are limited whereas incentives forproperty of less distinctive character may bequite significant.Rent for office and industrial spaceAnnual price charged in euros per squaremetre of lettable space, excluding value addedtax (VAT), service charges, fitting-outundertaken for specific tenants andincentives.Population and incomeThe reference date for the number ofinhabitants in a given municipality is 1 January2012. The population of working age is thenumber of persons in the 15 - 65 age bracketexpressed as a percentage of the totalpopulation. These figures come from a checkmade on 1 January 2011 (source: StatisticsNetherlands (CBS), processed by ABFResearch). Private disposable householdincome is expressed in thousands of eurosand related to 2009 (source: StatisticsNetherlands (CBS): Regional incomedistribution).Stock per inhabitantThe stock of office space is divided by thetotal population. The stock of business space(in sqm) per inhabitant is calculated byreducing the stock of business parks by a50% plot ratio and then divided by the totalpopulation. The figures for office stock havebeen taken from Bak, for the stock of businessparks from the Ministry of Housing, SpatialPlanning and the Environment’s SpaceDirectorate-General and for the populationfrom Statistics Netherlands (CBS), processedby ABF Research.Basis of the survey<strong>DTZ</strong> <strong>Zadelhoff</strong> devotes a great deal of careto collecting and checking property data.Figures for take-up and availability forinstance are developed by checking andsupplementing data, obtained fromPropertyNL and Vastgoedmarkt, by <strong>DTZ</strong>researchers and property agents active in theregion concerned. As a result of our methodswe are able to provide an accurate,nationwide picture of the open markets foroffice and industrial property.www.dtz.nlwww.dtz-ugl.com81
Table of contents<strong>DTZ</strong> <strong>Zadelhoff</strong> has been a leading name in commercial property for more than 40 years. Outstanding in its advice. A perfectionist inits work. <strong>DTZ</strong> <strong>Zadelhoff</strong> is part of the <strong>DTZ</strong> network which is now combined with UGL Services. The combined business of <strong>DTZ</strong> and UGLServices has 26,000 permanent employees operating across 208 offices in 52 countries. In the Netherlands, <strong>DTZ</strong> <strong>Zadelhoff</strong> has its ownoffices in 12 major towns and cities. <strong>DTZ</strong> <strong>Zadelhoff</strong> has its own in-house research team and more than 200 estate agents and adviserswho continually follow and clarify market movements. <strong>DTZ</strong> <strong>Zadelhoff</strong> is a limited partnership, in which its partners participate throughprivate limited companies. The combination <strong>DTZ</strong> and UGL Services has a minority stake in this partnership. UGL Services is a divisionof UGL Limited which is listed on the Australian Stock Exchange.<strong>DTZ</strong> <strong>Zadelhoff</strong>,Amsterdam officeP.O. Box 740301070 BA AmsterdamApollolaan 1501077 BG AmsterdamTel.: +31 20 6 644 644Fax: +31 20 6 716 392E-mail: amsterdam@dtz.nl<strong>DTZ</strong> <strong>Zadelhoff</strong>,Enschede officeDe Ruyterlaan 27511 JH EnschedeTel.: +31 53 4 300 900Fax: +31 53 4 304 647E-mail: enschede@dtz.nl<strong>DTZ</strong> <strong>Zadelhoff</strong>,Utrecht officeP.O. Box 191253501 DC UtrechtOorsprongpark 123581 ET UtrechtTel.: +31 30 2 332 552Fax: +31 30 2 310 543E-mail: utrecht@dtz.nl<strong>DTZ</strong> <strong>Zadelhoff</strong>,Corporate ServicesP.O. Box 191253501 DC UtrechtOorsprongpark 123581 ET UtrechtTel.: +31 30 2 320 000Fax: +31 30 2 369 102E-mail: cs@dtz.nl<strong>DTZ</strong> <strong>Zadelhoff</strong>,Arnhem officeP.O. Box 5736800 AN ArnhemMeander 6016825 ME ArnhemTel.: +31 26 4 452 445Fax: +31 26 3 513 909E-mail: arnhem@dtz.nl<strong>DTZ</strong> <strong>Zadelhoff</strong>,Groningen officeP.O. Box 8709700 AW GroningenUbbo Emmiussingel 29711 BH GroningenTel.: +31 50 3 141 232Fax: +31 50 3 185 160E-mail: groningen@dtz.nl<strong>DTZ</strong> <strong>Zadelhoff</strong>,Zwolle officeP.O. Box 3828000 AJ ZwolleBurg. van Royensingel 68011 CS ZwolleTel.: +31 38 4 258 800Fax: +31 38 4 258 822E-mail: zwolle@dtz.nl<strong>DTZ</strong> <strong>Zadelhoff</strong>,ResearchP.O. Box 740301070 BA AmsterdamApollolaan 1501077 GB AmsterdamTel.: +31 20 6 644 644Fax: +31 20 6 716 392E-mail: research@dtz.nl<strong>DTZ</strong> <strong>Zadelhoff</strong>,Breda officeP.O. Box 22164800 CE BredaClaudius Prinsenlaan 1484818 CP BredaTel.: +31 76 5 209 209Fax: +31 76 5 227 148E-mail: breda@dtz.nl<strong>DTZ</strong> <strong>Zadelhoff</strong>,‘s-Hertogenbosch officeP.O. Box 50655201 GB ‘s-HertogenboschPettelaarpark 645216 PP ‘s-HertogenboschTel.: +31 73 6 132 424Fax: +31 73 6 133 484E-mail: den-bosch@dtz.nl<strong>DTZ</strong> <strong>Zadelhoff</strong>,InvestmentsP.O. Box 740301070 BA AmsterdamApollolaan 1501077 BG AmsterdamTel.: +31 20 5 711 411Fax: +31 20 6 716 932E-mail: investments@dtz.nl<strong>DTZ</strong> <strong>Zadelhoff</strong>,Retail ServicesP.O. Box 191253501 DC UtrechtOorsprongpark 123581 ET UtrechtTel.: +31 30 6 022 211Fax: +31 30 6 022 811E-mail: retail@dtz.nl<strong>DTZ</strong> <strong>Zadelhoff</strong>,The Hague officeP.O. Box 856172508 CH The HagueParkstraat 832514 JG The HagueTel.: +31 70 3 550 550Fax: +31 70 3 512 005E-mail: den-haag@dtz.nl<strong>DTZ</strong> <strong>Zadelhoff</strong>,Hoofddorp officeP.O. Box 20282130 GE HoofddorpPolarisavenue 85a2132 JH HoofddorpTel.: +31 23 5 685 685Fax: +31 23 5 685 111E-mail: hoofddorp@dtz.nl<strong>DTZ</strong> <strong>Zadelhoff</strong>,Marketing & CommunicationsP.O. Box 191253501 DC UtrechtOorsprongpark 123581 ET UtrechtTel.: +31 30 2 320 000Fax: +31 30 2 888 694E-mail: marcom@dtz.nl<strong>DTZ</strong> <strong>Zadelhoff</strong>,Valuation Advisory ServicesP.O. Box 740301070 BA AmsterdamApollolaan 1501077 BG AmsterdamTel.: +31 20 8 407 260Fax: +31 20 6 716 932E-mail: vas@dtz.nl<strong>DTZ</strong> <strong>Zadelhoff</strong>,Eindhoven officeP.O. Box 9735600 AZ EindhovenBeemdstraat 95653 MA EindhovenTel.: +31 40 2 125 125Fax: +31 40 2 122 220E-mail: eindhoven@dtz.nl<strong>DTZ</strong> <strong>Zadelhoff</strong>,Rotterdam officeP.O. Box 9373000 AX RotterdamK.P. van der Mandelelaan 1103062 MB RotterdamTel.: +31 10 4 333 555Fax: +31 10 4 117 971E-mail: rotterdam@dtz.nl<strong>DTZ</strong> <strong>Zadelhoff</strong>,Asset ManagementP.O. Box 740301070 BA AmsterdamApollolaan 1501077 BG AmsterdamTel.: +31 20 6 644 644Fax: +31 20 6 716 392E-mail: assetmanagement@dtz.nl<strong>DTZ</strong> <strong>Zadelhoff</strong>,Property Management BVP.O. Box 191603501 DD UtrechtNieuwekade 153511 RV UtrechtTel.: +31 30 2 394 239Fax: +31 30 2 394 240E-mail: propertymanagement@dtz.nlwww.dtz.nlwww.dtz-ugl.com82
The Netherlands, a national pictureFact sheets office and industrial property markets | January 2013Utrecht, <strong>DTZ</strong> <strong>Zadelhoff</strong> v.o.f.ISBN 978 90 78197 355Design: Matt Art Concept & Design, HaarlemCover photosTop left: Viñoly, AmsterdamTop right: De Croon, ’s-HertogenboschCentre right: Offices Lage Weide, UtrechtBottom: Tesla EU Megacenter, TilburgNo parts of this publication may be copied and/or reproducedwithout acknowledgment of the original source. While the utmostcare has been taken in compiling this report, no liability can beaccepted regarding the accuracy of the data quoted.Additional copies of this report can be obtained from:<strong>DTZ</strong> <strong>Zadelhoff</strong>, Research department in Amsterdam,the Netherlands (tel. +31 20 6 644 644).This report is also available on our website www.dtz.nl.<strong>DTZ</strong> <strong>Zadelhoff</strong> is a Dutch general partnership consisting ofpartners participating through legal entities with limited liability.Produced by:<strong>DTZ</strong> <strong>Zadelhoff</strong>, ResearchApollolaan 1501077 BG Amsterdam, the NetherlandsTel.: +31 20 6 644 644E-mail: research@dtz.nlwww.dtz.nl© <strong>DTZ</strong> <strong>Zadelhoff</strong> 2013
01-2013www.dtz.nlwww.dtz-ugl.com