Simulation of the Effects of an Air Blast Wave - ELSA - Europa
Simulation of the Effects of an Air Blast Wave - ELSA - Europa
Simulation of the Effects of an Air Blast Wave - ELSA - Europa
- No tags were found...
Create successful ePaper yourself
Turn your PDF publications into a flip-book with our unique Google optimized e-Paper software.
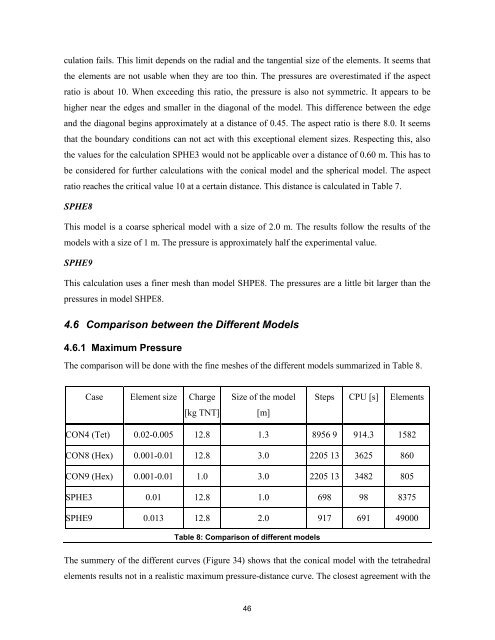
culation fails. This limit depends on <strong>the</strong> radial <strong>an</strong>d <strong>the</strong> t<strong>an</strong>gential size <strong>of</strong> <strong>the</strong> elements. It seems that<strong>the</strong> elements are not usable when <strong>the</strong>y are too thin. The pressures are overestimated if <strong>the</strong> aspectratio is about 10. When exceeding this ratio, <strong>the</strong> pressure is also not symmetric. It appears to behigher near <strong>the</strong> edges <strong>an</strong>d smaller in <strong>the</strong> diagonal <strong>of</strong> <strong>the</strong> model. This difference between <strong>the</strong> edge<strong>an</strong>d <strong>the</strong> diagonal begins approximately at a dist<strong>an</strong>ce <strong>of</strong> 0.45. The aspect ratio is <strong>the</strong>re 8.0. It seemsthat <strong>the</strong> boundary conditions c<strong>an</strong> not act with this exceptional element sizes. Respecting this, also<strong>the</strong> values for <strong>the</strong> calculation SPHE3 would not be applicable over a dist<strong>an</strong>ce <strong>of</strong> 0.60 m. This has tobe considered for fur<strong>the</strong>r calculations with <strong>the</strong> conical model <strong>an</strong>d <strong>the</strong> spherical model. The aspectratio reaches <strong>the</strong> critical value 10 at a certain dist<strong>an</strong>ce. This dist<strong>an</strong>ce is calculated in Table 7.SPHE8This model is a coarse spherical model with a size <strong>of</strong> 2.0 m. The results follow <strong>the</strong> results <strong>of</strong> <strong>the</strong>models with a size <strong>of</strong> 1 m. The pressure is approximately half <strong>the</strong> experimental value.SPHE9This calculation uses a finer mesh th<strong>an</strong> model SHPE8. The pressures are a little bit larger th<strong>an</strong> <strong>the</strong>pressures in model SHPE8.4.6 Comparison between <strong>the</strong> Different Models4.6.1 Maximum PressureThe comparison will be done with <strong>the</strong> fine meshes <strong>of</strong> <strong>the</strong> different models summarized in Table 8.Case Element size Charge[kg TNT]Size <strong>of</strong> <strong>the</strong> model[m]Steps CPU [s] ElementsCON4 (Tet) 0.02-0.005 12.8 1.3 8956 9 914.3 1582CON8 (Hex) 0.001-0.01 12.8 3.0 2205 13 3625 860CON9 (Hex) 0.001-0.01 1.0 3.0 2205 13 3482 805SPHE3 0.01 12.8 1.0 698 98 8375SPHE9 0.013 12.8 2.0 917 691 49000Table 8: Comparison <strong>of</strong> different modelsThe summery <strong>of</strong> <strong>the</strong> different curves (Figure 34) shows that <strong>the</strong> conical model with <strong>the</strong> tetrahedralelements results not in a realistic maximum pressure-dist<strong>an</strong>ce curve. The closest agreement with <strong>the</strong>46


