Simulation of the Effects of an Air Blast Wave - ELSA - Europa
Simulation of the Effects of an Air Blast Wave - ELSA - Europa
Simulation of the Effects of an Air Blast Wave - ELSA - Europa
- No tags were found...

You also want an ePaper? Increase the reach of your titles
YUMPU automatically turns print PDFs into web optimized ePapers that Google loves.
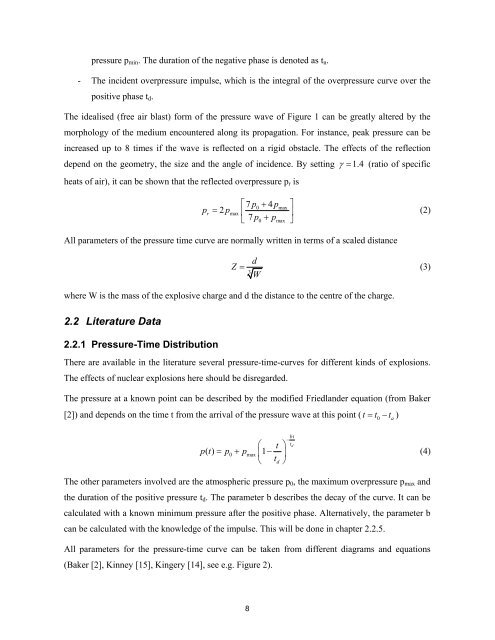
pressure p min . The duration <strong>of</strong> <strong>the</strong> negative phase is denoted as t n .- The incident overpressure impulse, which is <strong>the</strong> integral <strong>of</strong> <strong>the</strong> overpressure curve over <strong>the</strong>positive phase t d .The idealised (free air blast) form <strong>of</strong> <strong>the</strong> pressure wave <strong>of</strong> Figure 1 c<strong>an</strong> be greatly altered by <strong>the</strong>morphology <strong>of</strong> <strong>the</strong> medium encountered along its propagation. For inst<strong>an</strong>ce, peak pressure c<strong>an</strong> beincreased up to 8 times if <strong>the</strong> wave is reflected on a rigid obstacle. The effects <strong>of</strong> <strong>the</strong> reflectiondepend on <strong>the</strong> geometry, <strong>the</strong> size <strong>an</strong>d <strong>the</strong> <strong>an</strong>gle <strong>of</strong> incidence. By setting γ = 1.4 (ratio <strong>of</strong> specificheats <strong>of</strong> air), it c<strong>an</strong> be shown that <strong>the</strong> reflected overpressure p r ispr2 p⎡7p+ 4p0 max=max ⎢ ⎥7 p0 + pmax⎣⎤⎦(2)All parameters <strong>of</strong> <strong>the</strong> pressure time curve are normally written in terms <strong>of</strong> a scaled dist<strong>an</strong>ceZ = d3W(3)where W is <strong>the</strong> mass <strong>of</strong> <strong>the</strong> explosive charge <strong>an</strong>d d <strong>the</strong> dist<strong>an</strong>ce to <strong>the</strong> centre <strong>of</strong> <strong>the</strong> charge.2.2 Literature Data2.2.1 Pressure-Time DistributionThere are available in <strong>the</strong> literature several pressure-time-curves for different kinds <strong>of</strong> explosions.The effects <strong>of</strong> nuclear explosions here should be disregarded.The pressure at a known point c<strong>an</strong> be described by <strong>the</strong> modified Friedl<strong>an</strong>der equation (from Baker[2]) <strong>an</strong>d depends on <strong>the</strong> time t from <strong>the</strong> arrival <strong>of</strong> <strong>the</strong> pressure wave at this point ( t = t0−t a)⎛ t ⎞pt () = p0 + pmax⎜1−⎟⎝ td⎠bt−td(4)The o<strong>the</strong>r parameters involved are <strong>the</strong> atmospheric pressure p 0 , <strong>the</strong> maximum overpressure p max <strong>an</strong>d<strong>the</strong> duration <strong>of</strong> <strong>the</strong> positive pressure t d . The parameter b describes <strong>the</strong> decay <strong>of</strong> <strong>the</strong> curve. It c<strong>an</strong> becalculated with a known minimum pressure after <strong>the</strong> positive phase. Alternatively, <strong>the</strong> parameter bc<strong>an</strong> be calculated with <strong>the</strong> knowledge <strong>of</strong> <strong>the</strong> impulse. This will be done in chapter 2.2.5.All parameters for <strong>the</strong> pressure-time curve c<strong>an</strong> be taken from different diagrams <strong>an</strong>d equations(Baker [2], Kinney [15], Kingery [14], see e.g. Figure 2).8