Stabilizing India's population: easier said than done - Ined
Stabilizing India's population: easier said than done - Ined
Stabilizing India's population: easier said than done - Ined
- No tags were found...

You also want an ePaper? Increase the reach of your titles
YUMPU automatically turns print PDFs into web optimized ePapers that Google loves.
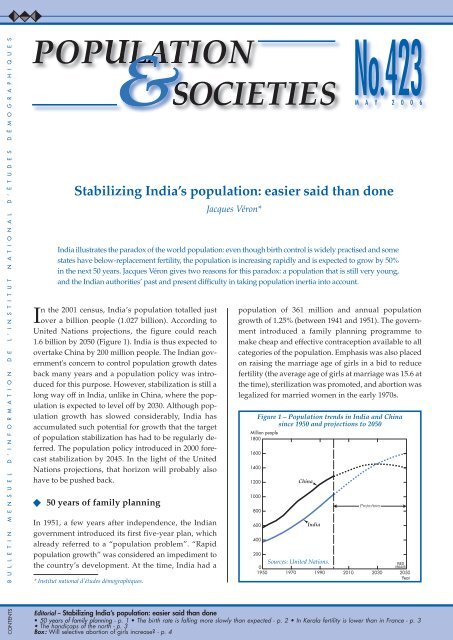
B U L L E T I N M E N S U E L D ’ I N F O R M A T I O N D E L ’ I N S T I T U T N A T I O N A L D ’ É T U D E S D É M O G R A P H I Q U E S<strong>Stabilizing</strong> India’s <strong>population</strong>: <strong>easier</strong> <strong>said</strong> <strong>than</strong> <strong>done</strong>In the 2001 census, India’s <strong>population</strong> totalled justover a billion people (1.027 billion). According toUnited Nations projections, the figure could reach1.6 billion by 2050 (Figure 1). India is thus expected toovertake China by 200 million people. The Indian government'sconcern to control <strong>population</strong> growth datesback many years and a <strong>population</strong> policy was introducedfor this purpose. However, stabilization is still along way off in India, unlike in China, where the <strong>population</strong>is expected to level off by 2030. Although <strong>population</strong>growth has slowed considerably, India hasaccumulated such potential for growth that the targetof <strong>population</strong> stabilization has had to be regularly deferred.The <strong>population</strong> policy introduced in 2000 forecaststabilization by 2045. In the light of the UnitedNations projections, that horizon will probably alsohave to be pushed back.50 years of family planningIn 1951, a few years after independence, the Indiangovernment introduced its first five-year plan, whichalready referred to a “<strong>population</strong> problem”. “Rapid<strong>population</strong> growth” was considered an impediment tothe country’s development. At the time, India had a* Institut national d’études démographiques.Jacques Véron*<strong>population</strong> of 361 million and annual <strong>population</strong>growth of 1.25% (between 1941 and 1951). The governmentintroduced a family planning programme tomake cheap and effective contraception available to allcategories of the <strong>population</strong>. Emphasis was also placedon raising the marriage age of girls in a bid to reducefertility (the average age of girls at marriage was 15.6 atthe time), sterilization was promoted, and abortion waslegalized for married women in the early 1970s.Million people18001600140012001000800600400Figure 1 – Population trends in India and Chinasince 1950 and projections to 2050ChinaIndiaNo.423M A Y 2 0 0 6India illustrates the paradox of the world <strong>population</strong>: even though birth control is widely practised and somestates have below-replacement fertility, the <strong>population</strong> is increasing rapidly and is expected to grow by 50%in the next 50 years. Jacques Véron gives two reasons for this paradox: a <strong>population</strong> that is still very young,and the Indian authorities’ past and present difficulty in taking <strong>population</strong> inertia into account.Projections200Sources: United Nations.INED0089A061950 1970 1990 2010 2030 2050YearCONTENTSEditorial – <strong>Stabilizing</strong> India’s <strong>population</strong>: <strong>easier</strong> <strong>said</strong> <strong>than</strong> <strong>done</strong>• 50 years of family planning - p. 1 • The birth rate is falling more slowly <strong>than</strong> expected - p. 2 • In Kerala fertility is lower <strong>than</strong> in France - p. 3• The handicaps of the north - p. 3Box: Will selective abortion of girls increase? - p. 4
2<strong>Stabilizing</strong> India’s <strong>population</strong>: <strong>easier</strong> <strong>said</strong> <strong>than</strong> <strong>done</strong>The policy of providing contraceptives soonproved inadequate. Opening family planning clinicswas not sufficient to bring down fertility. By the mid-1970s, family planning had clearly failed. The <strong>population</strong>was growing at a rate of 2.2% per year (at that rate,a <strong>population</strong> will double in 32 years). In 1975, the primeminister, Indira Gandhi, instigated emergency ruleand, in 1976, a “national <strong>population</strong> policy” was introducedand made a national priority. Although the averagenumber of children born to each woman hadstarted to fall, the <strong>population</strong> was still increasing at thesame pace. Compulsory sterilization for mothers ofthree or more children was considered. The zeal ofsome states resulted in 8.3 million sterilizations in 1976-1977, compared with a forecast of only 4.3 million.The Congress Party’s electoral defeat in 1977, duepartly to the unpopularity of forced sterilizations, appearedto signal the end of an active <strong>population</strong> policy.The “family planning” programme became a “familywelfare” programme, and reversible methods of8765432Figure 2 – Annual number of sterilizations in IndiaMillion91Source: [1].01955 1965 1975 1985 1995 2005Figure 3 – Fertility in India and China since 1950and projections to 2050Average number of children per woman76543210ChinaIndiaProjectionsINED090A06INED091A061950 1970 1990 2010 2030 2050YearSource: United Nations, medium scenario.contraception were encouraged. But the new governmentwas as concerned as its predecessor by the <strong>population</strong>problem, and the change in attitude was onlyapparent. Returned to power in 1980, having learnedthe lessons of her electoral demise, Indira Gandhi assertedthat, in order to achieve the target of family limitation,“persuasion” was preferable to “coercion”.“Family planning must come from the people, by thepeople and for the people,” she declared.Between 1970 and 2000, the percentage of couplesof childbearing age practising birth control rose fivefold,from 10% to 50%. Strikingly, although the use oforal contraceptives and intrauterine devices is officiallyencouraged, three-quarters of couples opt for sterilization.The number of sterilizations increased sharplyfrom the start of the 1980s, then stabilized at between4 million and 5 million per year (Figure 2). Over thesame period, sterilization has become female-only(98% in the late 1990s) (1).Despite a decline in fertility from the 1960s onwards,albeit less sharp <strong>than</strong> in China (Figure 3), India’s<strong>population</strong> was multiplied by 2.8 between 1951 and2001. In 2000, India introduced a new <strong>population</strong> policy,with new targets of replacement-level fertility by2010 and <strong>population</strong> stabilization by 2045. But thosetargets, like the previous ones, are likely to be thwartedby demographic inertia.The birth rate is falling more slowly<strong>than</strong> expectedIt would be wrong to claim that India’s <strong>population</strong> policyhas failed completely because <strong>population</strong> growthhas accelerated in spite of family planning programmes.Demographic inertia must be taken into account.The birth rate did fall in the 1970s and 1980s, butsince the death rate also fell, the growth rate did notcome down. The target of rapid <strong>population</strong> stabilizationis hampered by India’s young <strong>population</strong>. Eventhough fertility is falling, the number of people ofchildbearing age is increasing, so the number of birthsremains high. The Indian government is setting unrealistic<strong>population</strong> targets, in particular for the birth rate.The target set in 1962 was for the birth rate to fall from42 per 1,000 to 25 per 1,000 by 1973, but the actual ratein 1973 was 35 per 1,000 (Figure 4). A new target was setin the mid-1970s of 25 per 1,000 by 1984, but the actualrate was 34 per 1,000 by that date.(1) Although India’s Tenth Five-Year Plan (2002-2007) includes acommitment to promoting male sterilization, which is consideredmore effective <strong>than</strong> female sterilization, the trend seems unlikely toreverse.Population & Societies, 423, May 2006INED
<strong>Stabilizing</strong> India’s <strong>population</strong>: <strong>easier</strong> <strong>said</strong> <strong>than</strong> <strong>done</strong>3Figure 4 – Comparison between birth-rate targetsset by family planning programmes and actual birth ratesBirth rate (per 1,000)19624035302519661968Target lineswith date of adoptionINED550A04201960 1970 1980 1990 2000Source: [1]197319751977 1980 1981 Actual birth rate1992Aware of demographic inertia, the Indian governmentset different kinds of targets with different horizonsin the <strong>population</strong> policy introduced in 2000: animmediate target of meeting needs for contraception,healthcare infrastructure, staff and services to improvereproductive health; a medium-term target of fertilityat the replacement level (2010); and a long-term targetof <strong>population</strong> stabilization (2045).In Kerala fertility is lower <strong>than</strong> in FranceThough completed in southern India, the demographictransition is still underway in northern India, wherethe most populous states are located. Kerala State, inthe south, has long been an exception, with an earlyand rapid demographic transition: the crude birth ratedropped from 44 per 1,000 in the 1950s to 17 per 1,000in 2002, and fertility, which stood at 5.6 children perwoman in the 1950s, is now lower <strong>than</strong> in France(1.8 versus 1.9) (Table). The demographic transition iscomplete in the four southern states of Kerala, TamilNadu, Andhra Pradesh and Karnataka.The sweeping changes in those states can be attributedto effective <strong>population</strong> and development policies[2]. K. C. Zachariah lists many factors that have contributedto lowering fertility in Kerala: an increase inthe marriage age, contraception, sterilization, motherand-childhealth programmes, better education forwomen, measures in favour of gender equality, and thestates’ political commitment to welfare action [3]. Theincrease in the marriage age is estimated to account for30% of the decline in fertility between 1968 and1978. Contraceptive use has also spread rapidly: theTable - Population in 2001 and <strong>population</strong> indicators in2002 in the largest states of IndiaStatePopulationin 2001(million)Fertility (averagenumberof childrenper woman)Andhra Pradesh 76 2.2 62 1.3Assam 27 3.0 70 1.7West Bengal 80 2.3 49 1.4Bihar 83 4.3 61 2.3Gujarat 51 2.8 60 1.7Haryana 21 3.1 62 2.0Karnataka 53 2.4 55 1.5Kerala 32 1.8 10 1.0Madhya Pradesh 60 3.8 85 2.0Maharashtra 97 2.3 45 1.3Orissa 37 2.6 87 1.3Punjab 24 2.3 51 1.4Rajas<strong>than</strong> 57 3.9 78 2.3Tamil Nadu 62 2.0 44 1.1Uttar Pradesh 166 4.4 80 2.2India (1) 1,027 3.0 63 1.7(1) The national total includes the <strong>population</strong> of small states thatare not shown in this table.Source: Census of India (2001) and Sample Registration System (2004).percentage of women of childbearing age using contraceptivesrose from 37% in 1981 to 72% in 1992. A highrate of infant mortality is considered to hold back fertilitydecline because parents have many children to ensurethat some survive to adulthood. The vaccinationprogramme launched in 1985, which covered half of allchildren and reduced infant mortality, thus also contributedto the fertility decline. Zachariah attributes therapid decline in fertility to interaction effects betweenthe provision of family planning services and an improvementin the socioeconomic environment. But arapid decline in fertility may also be due to a high levelof poverty. In a context of economic stagnation, as inTamil Nadu for example, parents who want a better lifefor their children can only achieve their aspiration bylimiting their family size, thereby lowering fertility.The handicaps of the northInfantmortality(per1,000)Naturalincrease (%)In the densely populated states of the north – UttarPradesh, Bihar, Madhya Pradesh and Rajas<strong>than</strong> – <strong>population</strong>growth is still rapid, with annual rates of increaseabove 2%. Those four states, home to 365 millionpeople in 2001, represent a large share of the nationaltotal and account for the apparently slow pace of demographicchange in India. The annual rate of naturalincrease is the highest in Bihar (2.3% in 2002). In UttarPradesh, Bihar, Madhya Pradesh and Rajas<strong>than</strong>, birthrates were above 30 per 1,000 in 2002, and fertility wasaround 4 children per woman, compared with aINED Population & Societies, 423, May 2006
4 <strong>Stabilizing</strong> India’s <strong>population</strong>: <strong>easier</strong> <strong>said</strong> <strong>than</strong> <strong>done</strong>national average of 3 childrenper woman. Women in UttarAFGHANISTANPradesh, India’s most populousstate (166 million people in 2001)gave birth to an average of4.4 children in 2002. In the northernstates, a combination of factorsis delaying demographicPAKISTANtransition: a lower level of education,in particular among women(Map); less favourable gender relations;higher infant and childRajas<strong>than</strong>mortality; lower coverage byhealthcare services; and less politicalcommitment to familyGujaratplanning programmes [4].* * *India’s <strong>population</strong> will inevitablycontinue to grow for at least50 years, increasing by a half overthe period. The country must alsoGoastruggle with persistent poverty,widespread under-employmentand unemployment, andsevere environmental damage.Improving life for the wholeKerala<strong>population</strong> – not just the urbanmiddle class – and providing decentliving conditions for an additional500 million people by 2050 is the formidablesustainable development challenge facing India.Jammu and KashmirPunjabMaharashtraKarnatakaHaryanaHimachalPradeshDelhiUttaranchalMadhya PradeshTamil NaduAndhra PradeshSRI LANKAUttar PradeshChhattisgarhCHINANEPALLevel of education of womenin India’s states (2001)BiharJharkhandOrissaSikkimWestBengalPercentage of literatewoman (%)< 4040 - 5252 - 6464 - 7575 +REFERENCESBHUTANAssamMeghalayaBANGLADESHTripuraSource: Census of India, 2001.ArunachalPradeshMizoramNagalandManipurBURMAINED093A06BoxWill selective abortion of girls increase?The last census revealed a substantial numerical imbalancebetween boys and girls in some states of India. InHaryana and Punjab, for example, 120 boys were bornfor every 100 girls in 2001 [5]. This imbalance can beattributed to the decline in fertility. Couples want fewerchildren and, given a strong traditional preference forboys, they use prenatal ultrasound scans to determine thesex of the unborn baby and often decide to abort femalefoetuses.A law was passed in 1994 banning the use of prenatalultrasound scans for sex selection, and efforts to combatselective abortion were recently stepped up. Despitethese measures, the sex ratio continues to increase. Sexselection is particularly hard to curb because it is practisedeven among “educated” couples. Stronger public action toreduce fertility may even expand the practice. The persistenceof dowries despite an official ban dating from 1961is also a factor. As living standards rise, the cost ofdowries has even increased, exacerbating discriminationagainst girls.[1] Irudaya S. RAJAN and Jacques VÉRON - 2006, “La politiquede <strong>population</strong> de l’Inde face à l’inertie des évolutionsdémographiques”, Démographie: analyse et synthèse, editedby G. CASELLI, J. VALLIN and G. WUNSCH, volume VII, ParisINED, pp. 537-565[2] S. KRISHNAMOORTHY, P. M. KULKARNI and N. AUDINARAYANA -2005, “Causes of Fertility Transition in Tamil Nadu”, inFertility Transition in South India, C. Z. GUILMOTO and S. I.RAJAN (eds.), New Delhi, Sage Publications, pp. 227-247[3] K. C. Zachariah - 1997, Demographic Transition : AResponse to official Policies and Programmes, inK. C. ZACHARIAH and S. Irudaya RAJAN (eds.) Kerala’sDemographic Transition, Determinants and Consequences, NewDelhi, Sage Publications, pp. 79-111[4] Sadasivan P. NAIR and Jacques VÉRON - 2002, “L’Inde: unmilliard d’habitants en 2001”, in La Population dumonde, Géants démographiques et défis internationaux,J. C. CHASTELAND and J.-C. CHESNAIS (eds.), Les Cahiers del’<strong>Ined</strong>, no. 149, pp. 227-243[5] Aswini K. NANDA and Jacques VÉRON - 2004, “Child SexRatio Imbalances, Fertility Behaviour and Development inIndia: Recent Evidence from Haryana and Punjab”, IndianSocial Science Review, Volume 6, Number 2, pp.101-134Population & Societies - no. 423, May 2006 – <strong>Stabilizing</strong> India’s <strong>population</strong>: <strong>easier</strong> <strong>said</strong> <strong>than</strong> <strong>done</strong> ISSN 0184 77 83Director of Publications: François Héran – Editor-in-chief: Gilles Pison – Translations Coordinator: Catriona Dutreuilh – Design and layout: Isabelle Brianchon –D.L. 2 e term. 2006 – INED: 133. boulevard Davout - 75980 Paris. Cedex 20. France – Telephone: (33) (0)1 56 06 20 00 – Fax: (33) (0)1 56 06 21 99 –http://www.ined.fr – e.mail: ined@ined.fr