Laboratory Testing of Fatigue Crack Growth in Geosynthetically ...
Laboratory Testing of Fatigue Crack Growth in Geosynthetically ...
Laboratory Testing of Fatigue Crack Growth in Geosynthetically ...
- No tags were found...

Create successful ePaper yourself
Turn your PDF publications into a flip-book with our unique Google optimized e-Paper software.
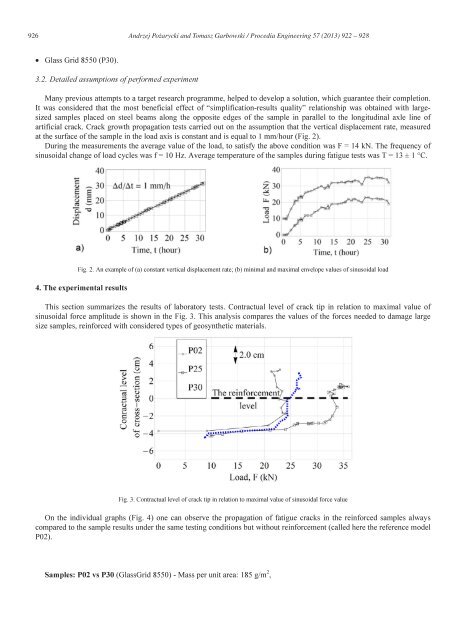
926 Andrzej Pożarycki and Tomasz Garbowski / Procedia Eng<strong>in</strong>eer<strong>in</strong>g 57 ( 2013 ) 922 – 928• Glass Grid 8550 (P30).3.2. Detailed assumptions <strong>of</strong> performed experimentMany previous attempts to a target research programme, helped to develop a solution, which guarantee their completion.It was considered that the most beneficial effect <strong>of</strong> “simplification-results quality” relationship was obta<strong>in</strong>ed with largesizedsamples placed on steel beams along the opposite edges <strong>of</strong> the sample <strong>in</strong> parallel to the longitud<strong>in</strong>al axle l<strong>in</strong>e <strong>of</strong>artificial crack. <strong>Crack</strong> growth propagation tests carried out on the assumption that the vertical displacement rate, measuredat the surface <strong>of</strong> the sample <strong>in</strong> the load axis is constant and is equal to 1 mm/hour (Fig. 2).Dur<strong>in</strong>g the measurements the average value <strong>of</strong> the load, to satisfy the above condition was F = 14 kN. The frequency <strong>of</strong>s<strong>in</strong>usoidal change <strong>of</strong> load cycles was f = 10 Hz. Average temperature <strong>of</strong> the samples dur<strong>in</strong>g fatigue tests was T = 13 ± 1 °C.Fig. 2. An example <strong>of</strong> (a) constant vertical displacement rate; (b) m<strong>in</strong>imal and maximal envelope values <strong>of</strong> s<strong>in</strong>usoidal load4. The experimental resultsThis section summarizes the results <strong>of</strong> laboratory tests. Contractual level <strong>of</strong> crack tip <strong>in</strong> relation to maximal value <strong>of</strong>s<strong>in</strong>usoidal force amplitude is shown <strong>in</strong> the Fig. 3. This analysis compares the values <strong>of</strong> the forces needed to damage largesize samples, re<strong>in</strong>forced with considered types <strong>of</strong> geosynthetic materials.Fig. 3. Contractual level <strong>of</strong> crack tip <strong>in</strong> relation to maximal value <strong>of</strong> s<strong>in</strong>usoidal force valueOn the <strong>in</strong>dividual graphs (Fig. 4) one can observe the propagation <strong>of</strong> fatigue cracks <strong>in</strong> the re<strong>in</strong>forced samples alwayscompared to the sample results under the same test<strong>in</strong>g conditions but without re<strong>in</strong>forcement (called here the reference modelP02).Samples: P02 vs P30 (GlassGrid 8550) - Mass per unit area: 185 g/m 2 ,