Van Gunst, K.J. 2012. Forest Mortality in Lake Tahoe Basin from ...
Van Gunst, K.J. 2012. Forest Mortality in Lake Tahoe Basin from ...
Van Gunst, K.J. 2012. Forest Mortality in Lake Tahoe Basin from ...
- No tags were found...

Create successful ePaper yourself
Turn your PDF publications into a flip-book with our unique Google optimized e-Paper software.
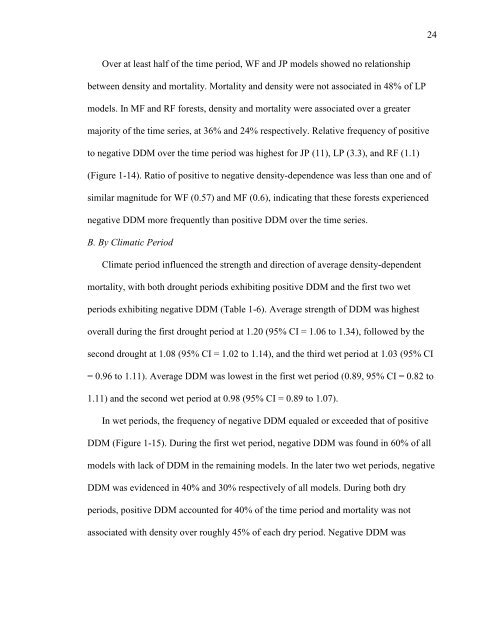
24Over at least half of the time period, WF and JP models showed no relationshipbetween density and mortality. <strong>Mortality</strong> and density were not associated <strong>in</strong> 48% of LPmodels. In MF and RF forests, density and mortality were associated over a greatermajority of the time series, at 36% and 24% respectively. Relative frequency of positiveto negative DDM over the time period was highest for JP (11), LP (3.3), and RF (1.1)(Figure 1-14). Ratio of positive to negative density-dependence was less than one and ofsimilar magnitude for WF (0.57) and MF (0.6), <strong>in</strong>dicat<strong>in</strong>g that these forests experiencednegative DDM more frequently than positive DDM over the time series.B. By Climatic PeriodClimate period <strong>in</strong>fluenced the strength and direction of average density-dependentmortality, with both drought periods exhibit<strong>in</strong>g positive DDM and the first two wetperiods exhibit<strong>in</strong>g negative DDM (Table 1-6). Average strength of DDM was highestoverall dur<strong>in</strong>g the first drought period at 1.20 (95% CI = 1.06 to 1.34), followed by thesecond drought at 1.08 (95% CI = 1.02 to 1.14), and the third wet period at 1.03 (95% CI= 0.96 to 1.11). Average DDM was lowest <strong>in</strong> the first wet period (0.89, 95% CI = 0.82 to1.11) and the second wet period at 0.98 (95% CI = 0.89 to 1.07).In wet periods, the frequency of negative DDM equaled or exceeded that of positiveDDM (Figure 1-15). Dur<strong>in</strong>g the first wet period, negative DDM was found <strong>in</strong> 60% of allmodels with lack of DDM <strong>in</strong> the rema<strong>in</strong><strong>in</strong>g models. In the later two wet periods, negativeDDM was evidenced <strong>in</strong> 40% and 30% respectively of all models. Dur<strong>in</strong>g both dryperiods, positive DDM accounted for 40% of the time period and mortality was notassociated with density over roughly 45% of each dry period. Negative DDM was