

English - UNDP
English - UNDP
English - UNDP
- No tags were found...

Create successful ePaper yourself
Turn your PDF publications into a flip-book with our unique Google optimized e-Paper software.
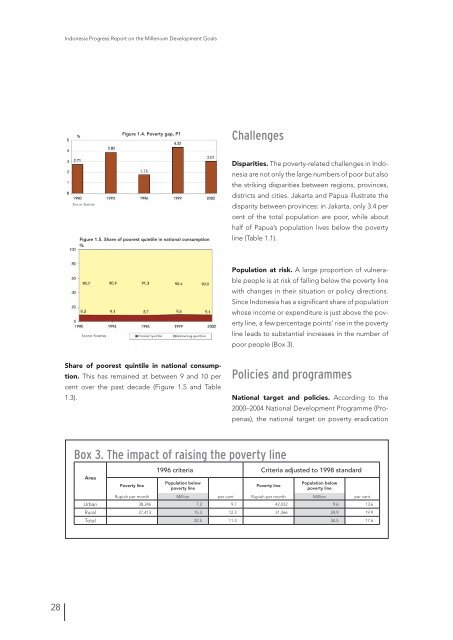
Indonesia Progress Report on the Millenium Development GoalsFigure 1.4. Poverty gap, P1ChallengesFigure 1.5. Share of poorest quintile in national consumption%Disparities. The poverty-related challenges in Indonesiaare not only the large numbers of poor but alsothe striking disparities between regions, provinces,districts and cities. Jakarta and Papua illustrate thedisparity between provinces: in Jakarta, only 3.4 percent of the total population are poor, while abouthalf of Papua’s population lives below the povertyline (Table 1.1).Population at risk. A large proportion of vulnerablepeople is at risk of falling below the poverty linewith changes in their situation or policy directions.Since Indonesia has a significant share of populationwhose income or expenditure is just above the povertyline, a few percentage points’ rise in the povertyline leads to substantial increases in the number ofpoor people (Box 3).Share of poorest quintile in national consumption.This has remained at between 9 and 10 percent over the past decade (Figure 1.5 and Table1.3).Policies and programmesNational target and policies. According to the2000–2004 National Development Programme (Propenas),the national target on poverty eradicationBox 3. The impact of raising the poverty lineAreaPoverty line1996 criteria Criteria adjusted to 1998 standardPopulation belowpoverty linePoverty linePopulation belowpoverty lineRupiah per month Million per cent Rupiah per month Million per centUrban 38,246 7.2 9.7 42,032 9.6 13.6Rural 27,413 15.3 12.3 31,366 24.9 19.9Total 22.5 11.3 34.5 17.628


