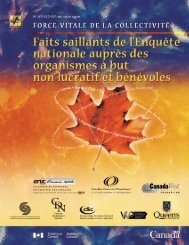
CSGVP: 07GIVING AND VOLUNTEERING IN ONTARIOFigure 1.1: Percentage of population donat<strong>in</strong>g to charitable <strong>and</strong> nonprofit organizations, bytype of donation, population aged 15 <strong>and</strong> older, <strong>Ontario</strong>, 2004 <strong>and</strong> 2007.100%90%86%84%81%% population donat<strong>in</strong>g75%50%25%69%63%0%Donor rate Food Cloth<strong>in</strong>g or goods Included donation <strong>in</strong> will or life<strong>in</strong>surance4%5%Types of donation2004 2007In total, Ontarians gave over $4.4 billion <strong>in</strong> f<strong>in</strong>ancial support to charitable <strong>and</strong> nonprofitorganizations <strong>in</strong> 2007 (see Table 1.1), an <strong>in</strong>crease of approximately $73 million from 2004.<strong>Ontario</strong> donors gave an average of $501 each (a 2.7% <strong>in</strong>crease from 2004). 1 Becauseaverages can be affected by extreme values, the median may be a better <strong>in</strong>dication of thetypical size of a donation. 2 In <strong>Ontario</strong>, the median donation was $150, mean<strong>in</strong>g that half ofall Ontarians donated less than $150 <strong>and</strong> half donated more.Table 1.1: Donors <strong>and</strong> donations, population aged 15 <strong>and</strong> older, <strong>Ontario</strong>, 2007.Rate of donat<strong>in</strong>g 2007 2004Total population (thous<strong>and</strong>s) 10,473 10,000Donors (thous<strong>and</strong>s) 8,967 9,000Donor rate 86% 90%Number of donationsTotal number (thous<strong>and</strong>s) 35,525 41,381Average number per donor 4 4.6Amount donatedTotal amount (thous<strong>and</strong>s) $4,489,900 $4,415,578Average annual amount per donor $501 $488Median annual amount per donor $150 $150Average amount per donation $126 $107In 2007, Ontarians were roughly as likely as residents of most other prov<strong>in</strong>ces to reportmak<strong>in</strong>g a f<strong>in</strong>ancial donation (see Figure 1.2). This was somewhat different from 2004, whenOntarians were somewhat more likely than residents of most other prov<strong>in</strong>ces to donate.However, Ontarians no longer st<strong>and</strong> out <strong>in</strong> terms of the amounts they donate, rank<strong>in</strong>gsquarely <strong>in</strong> the middle of the prov<strong>in</strong>ces <strong>in</strong> 2007 (see Figure 1.3); <strong>in</strong> 2004 Ontarians donatedthe second largest amount.!1 Note this <strong>in</strong>crease does not account for the effects of <strong>in</strong>flation.2 The median donation is the “half way po<strong>in</strong>t” of donations, mean<strong>in</strong>g that half of donors contributed more <strong>and</strong>half contributed less than the median value.GIVINGANDVOLUNTEERING.CA3
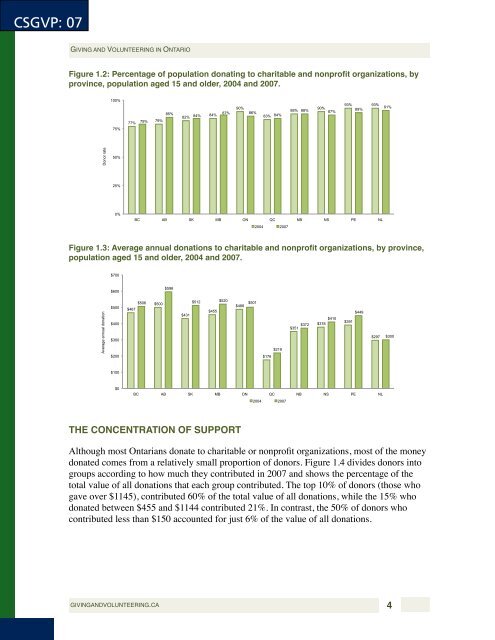
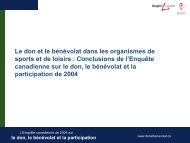
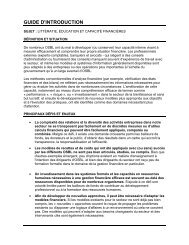
CSGVP: 07GIVING AND VOLUNTEERING IN ONTARIOFigure 1.2: Percentage of population donat<strong>in</strong>g to charitable <strong>and</strong> nonprofit organizations, byprov<strong>in</strong>ce, population aged 15 <strong>and</strong> older, 2004 <strong>and</strong> 2007.100%75%77%79%79%85%82%84%84%90%87% 86%83% 84%90%88% 88% 87%93% 93%89%91%Donor rate50%25%0%BC AB SK MB ON QC NB NS PE NL2004 2007Figure 1.3: Average annual donations to charitable <strong>and</strong> nonprofit organizations, by prov<strong>in</strong>ce,population aged 15 <strong>and</strong> older, 2004 <strong>and</strong> 2007.$700$600$596Average annual donation$500$400$300$200$467$506$500$431$512 $520$455$488$501$176$219$372$351$410$378$391$449$297$300$100$0BC AB SK MB ON QC NB NS PE NL2004 2007THE CONCENTRATION OF SUPPORTAlthough most Ontarians donate to charitable or nonprofit organizations, most of the moneydonated comes from a relatively small proportion of donors. Figure 1.4 divides donors <strong>in</strong>togroups accord<strong>in</strong>g to how much they contributed <strong>in</strong> 2007 <strong>and</strong> shows the percentage of thetotal value of all donations that each group contributed. The top 10% of donors (those whogave over $1145), contributed 60% of the total value of all donations, while the 15% whodonated between $455 <strong>and</strong> $1144 contributed 21%. In contrast, the 50% of donors whocontributed less than $150 accounted for just 6% of the value of all donations.GIVINGANDVOLUNTEERING.CA4