Property Times European Shopping Centres 2010 Shift to value-add ...
Property Times European Shopping Centres 2010 Shift to value-add ...
Property Times European Shopping Centres 2010 Shift to value-add ...

You also want an ePaper? Increase the reach of your titles
YUMPU automatically turns print PDFs into web optimized ePapers that Google loves.
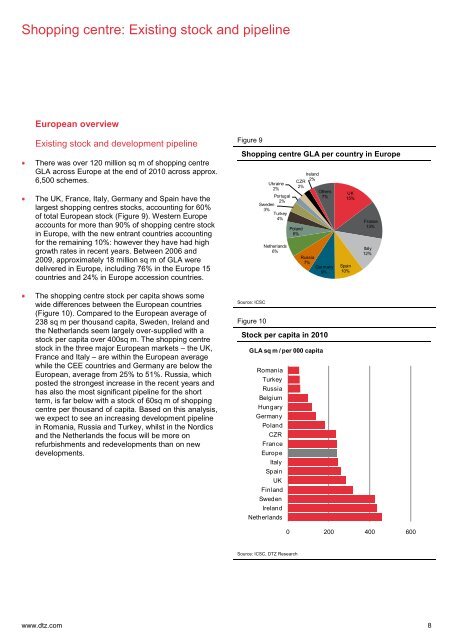
<strong>Shopping</strong> centre: Existing s<strong>to</strong>ck and pipeline<strong>European</strong> overviewExisting s<strong>to</strong>ck and development pipelineThere was over 120 million sq m of shopping centreGLA across Europe at the end of <strong>2010</strong> across approx.6,500 schemes.The UK, France, Italy, Germany and Spain have thelargest shopping centres s<strong>to</strong>cks, accounting for 60%of <strong>to</strong>tal <strong>European</strong> s<strong>to</strong>ck (Figure 9). Western Europeaccounts for more than 90% of shopping centre s<strong>to</strong>ckin Europe, with the new entrant countries accountingfor the remaining 10%: however they have had highgrowth rates in recent years. Between 2006 and2009, approximately 18 million sq m of GLA weredelivered in Europe, including 76% in the Europe 15countries and 24% in Europe accession countries.The shopping centre s<strong>to</strong>ck per capita shows somewide differences between the <strong>European</strong> countries(Figure 10). Compared <strong>to</strong> the <strong>European</strong> average of238 sq m per thousand capita, Sweden, Ireland andthe Netherlands seem largely over-supplied with as<strong>to</strong>ck per capita over 400sq m. The shopping centres<strong>to</strong>ck in the three major <strong>European</strong> markets – the UK,France and Italy – are within the <strong>European</strong> averagewhile the CEE countries and Germany are below the<strong>European</strong>, average from 25% <strong>to</strong> 51%. Russia, whichposted the strongest increase in the recent years andhas also the most significant pipeline for the shortterm, is far below with a s<strong>to</strong>ck of 60sq m of shoppingcentre per thousand of capita. Based on this analysis,we expect <strong>to</strong> see an increasing development pipelinein Romania, Russia and Turkey, whilst in the Nordicsand the Netherlands the focus will be more onrefurbishments and redevelopments than on newdevelopments.Figure 9<strong>Shopping</strong> centre GLA per country in EuropeSource: ICSCFigure 10Ukraine2%Portugal2%Sweden3%Turkey4%Netherlands6%CZR2%Poland6%Ireland2%Russia7%Germany9%S<strong>to</strong>ck per capita in <strong>2010</strong>GLA sq m / per 000 capitaRomaniaTurkeyRussiaBelgiumHungaryGermanyPolandCZRFranceEuropeItalySpainUKFinlandSwedenIrelandNetherlandsOthers7%UK15%Spain10%France13%Italy12%0 200 400 600Source: ICSC, DTZ Researchwww.dtz.com 8