Perc105Percen105120-52000 2001 2002 2003 2004 2005 2006Impact of rising feed ingredient prices on aquafeeds and aquaculture production02000 2001 2002 2003 2004 2005 2006Percentage contributionFIGURE 7Percentage contribution of main species toaquaculture production in IndiaRohuSilver carpOther Catla freshwater fishes Silver Catla carpMrigal MrigalOther Penaeus freshwater shrimpsfishesGiant Freshwater river prawn siluroidcatfishesGiant river prawn30 RohuSnakeheadsGiant tiger prawn254520 40Percentage contribution3515 302510205 1510052000 2001 2002 2003 2004 2005 200602000 2001 2002 2003 2004 2005 2006Source: Adapted from FAO (2008a).FIGURE 8Percentage contribution of main species toaquaculture production in MyanmarPercentage contribution1009080706050403020100Other freshwaterfishesGiant tiger prawnPangas catfishes2000 2001 2002 2003 2004 2005 2006Source: Adapted from FAO (2008a).RohuCommon carpTilapiasfuture in the subregion is localized and may notbe as high as in the Southeast Asian subregion.However, the trend in switching from extensiveto semi-intensive carp culture will increase thedemand for feed ingredients.1.3.2 Trends in intensification Pangas catfishes of100aquaculture practices90Aquafeeds usually80account for 50–70 percent ofproduction costs. 70Therefore, for most farmingoperations, the price 60 of fish influences theexpenditures for inputs 50 such as feeds and feedingredients. In general, 40 low-value freshwaterspecies are cultured 30in extensive or semi-intensive20systems that need great volumes of water and10land area, and inputs may be limited to fertilizers0and single‐ingredient farm-made aquafeeds.Accordingly, productivity is lower than that ofhigher value‐species cultured in intensive systemsusing <strong>com</strong>mercially formulated aquafeeds.Land and water resources, however, are alreadyin short supply in many leading aquacultureproducing countries in Asia due to land tenurestructures, urbanization and industrialization,and <strong>com</strong>peting demand for land and water forirrigation, <strong>com</strong>pounded by increasing humanpopulation.Current world aquaculture production,particularly low-value species, is heavily dependenton land-based production systems. In China,production in ponds accounted for 77 percentof the total inland aquaculture production (Ye,1996). In the last decade, pond culture contributed70–90 percent of total freshwater aquacultureproduction in Thailand (WorldFish Center, 2004a).FAO (2000) reported that about 78 percent ofIndonesian farming households cultivate fish insmall ponds of less than 500 m 2 , and aquacultureis the main source of in<strong>com</strong>e for 66 percent of the2000 2001 2002 2003 2004 2005 2006households that cultivate fish in the paddies and ponds (WorldFish Center, 2004b). Themost important farming system in Viet Nam is pond polyculture <strong>com</strong>monly stockedwith Chinese carps (silver carp, grass carp and bighead) in the northern region and rivercatfish, <strong>com</strong>mon carp and Indian major carps (rohu, mrigal) in the southern region(WorldFish Center, 2004c). In recent years, red tilapia is cultured in ponds by using anintensive monoculture system. In addition, an integrated VAC system (V: garden, A: fishpond, C: livestock) is also <strong>com</strong>mon in Viet Nam. Thus, it can be estimated that overall70–80 percent of freshwater aquaculture production in leading aquaculture producingcountries <strong>com</strong>es from ponds and, therefore, land-based aquaculture will play animportant role in future world aquaculture production. The availability of and continuedaccess to land as well as fish prices, however, will dictate the pace of intensification.To illustrate the challenges of meeting the projected aquaculture production in 2020in two leading aquaculture producing countries, China and India, an increase in pondarea would be on the order of 75 and 310 percent, respectively, in 2006 (Table 12).Percentage contributionOther freshwaterfishesGiant tiger prawnRohuCommon carpTilapias
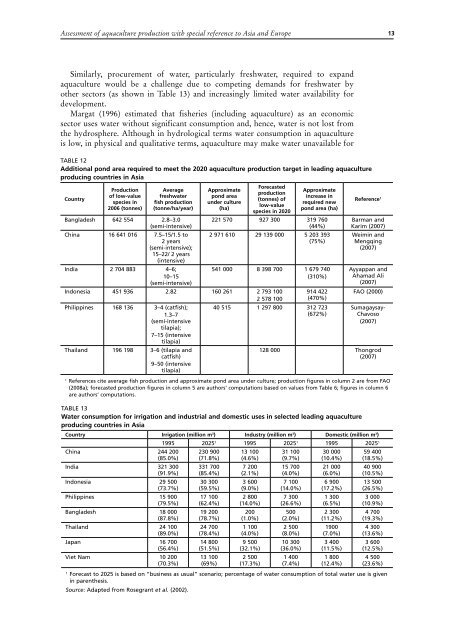
Assessment of aquaculture production with special reference to Asia and Europe13Similarly, procurement of water, particularly freshwater, required to expandaquaculture would be a challenge due to <strong>com</strong>peting demands for freshwater byother sectors (as shown in Table 13) and increasingly limited water availability fordevelopment.Margat (1996) estimated that fisheries (including aquaculture) as an economicsector uses water without significant consumption and, hence, water is not lost fromthe hydrosphere. Although in hydrological terms water consumption in aquacultureis low, in physical and qualitative terms, aquaculture may make water unavailable forTable 12Additional pond area required to meet the 2020 aquaculture production target in leading aquacultureproducing countries in AsiaCountryProductionof low-valuespecies in2006 (tonnes)Averagefreshwaterfish production(tonne/ha/year)Bangladesh 642 554 2.8–3.0(semi-intensive)China 16 641 016 7.5–15/1.5 to2 years(semi-intensive);15–22/ 2 years(intensive)India 2 704 883 4–6;10–15(semi-intensive)Approximatepond areaunder culture(ha)Forecastedproduction(tonnes) oflow-valuespecies in 2020Approximateincrease inrequired newpond area (ha)221 570 927 300 319 760(44%)2 971 610 29 139 000 5 203 393(75%)541 000 8 398 700 1 679 740(310%)Indonesia 451 936 2.82 160 261 2 793 1002 578 100Philippines 168 136 3–4 (catfish);1.3–7(semi-intensivetilapia);7–15 (intensivetilapia)Thailand 196 198 3–6 (tilapia andcatfish)9–50 (intensivetilapia)914 422(470%)40 515 1 297 800 312 723(672%)Reference 1Barman andKarim (2007)Weimin andMengqing(2007)Ayyappan andAhamad Ali(2007)FAO (2000)Sumagaysay-Chavoso(2007)128 000 Thongrod(2007)1References cite average fish production and approximate pond area under culture; production figures in column 2 are from FAO(2008a); forecasted production figures in column 5 are authors’ <strong>com</strong>putations based on values from Table 6; figures in column 6are authors’ <strong>com</strong>putations.Table 13Water consumption for irrigation and industrial and domestic uses in selected leading aquacultureproducing countries in AsiaCountry Irrigation (million m 3 ) Industry (million m 3 ) Domestic (million m 3 )China 244 200(85.0%)India 321 300(91.9%)Indonesia 29 500(73.7%)Philippines 15 900(79.5%)Bangladesh 18 000(87.8%)Thailand 24 100(89.0%)Japan 16 700(56.4%)Viet Nam 10 200(70.3%)1995 2025 1 1995 2025 1 1995 2025 1230 900(71.8%)331 700(85.4%)30 300(59.5%)17 100(62.4%)19 200(78.7%)24 700(78.4%)14 800(51.5%)13 100(69%)13 100(4.6%)7 200(2.1%)3 600(9.0%)2 800(14.0%)200(1.0%)1 100(4.0%)9 500(32.1%)2 500(17.3%)31 100(9.7%)15 700(4.0%)7 100(14.0%)7 300(26.6%)500(2.0%)2 500(8.0%)10 300(36.0%)1 400(7.4%)30 000(10.4%)21 000(6.0%)6 900(17.2%)1 300(6.5%)2 300(11.2%)1900(7.0%)3 400(11.5%)1 800(12.4%)59 400(18.5%)40 900(10.5%)13 500(26.5%)3 000(10.9%)4 700(19.3%)4 300(13.6%)3 600(12.5%)4 500(23.6%)1Forecast to 2025 is based on “business as usual” scenario; percentage of water consumption of total water use is givenin parenthesis.Source: Adapted from Rosegrant et al. (2002).


