Read Document - AquaFeed.com
Read Document - AquaFeed.com
Read Document - AquaFeed.com

Create successful ePaper yourself
Turn your PDF publications into a flip-book with our unique Google optimized e-Paper software.
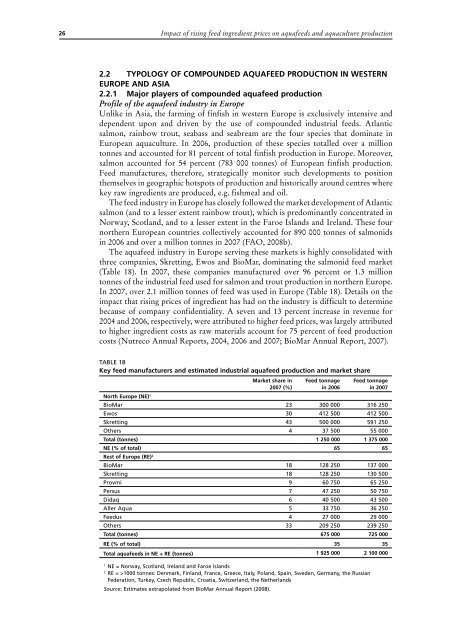
26Impact of rising feed ingredient prices on aquafeeds and aquaculture production2.2 Typology of <strong>com</strong>pounded aquafeed production in westernEurope and Asia2.2.1 Major players of <strong>com</strong>pounded aquafeed productionProfile of the aquafeed industry in EuropeUnlike in Asia, the farming of finfish in western Europe is exclusively intensive anddependent upon and driven by the use of <strong>com</strong>pounded industrial feeds. Atlanticsalmon, rainbow trout, seabass and seabream are the four species that dominate inEuropean aquaculture. In 2006, production of these species totalled over a milliontonnes and accounted for 81 percent of total finfish production in Europe. Moreover,salmon accounted for 54 percent (783 000 tonnes) of European finfish production.Feed manufactures, therefore, strategically monitor such developments to positionthemselves in geographic hotspots of production and historically around centres wherekey raw ingredients are produced, e.g. fishmeal and oil.The feed industry in Europe has closely followed the market development of Atlanticsalmon (and to a lesser extent rainbow trout), which is predominantly concentrated inNorway, Scotland, and to a lesser extent in the Faroe Islands and Ireland. These fournorthern European countries collectively accounted for 890 000 tonnes of salmonidsin 2006 and over a million tonnes in 2007 (FAO, 2008b).The aquafeed industry in Europe serving these markets is highly consolidated withthree <strong>com</strong>panies, Skretting, Ewos and BioMar, dominating the salmonid feed market(Table 18). In 2007, these <strong>com</strong>panies manufactured over 96 percent or 1.3 milliontonnes of the industrial feed used for salmon and trout production in northern Europe.In 2007, over 2.1 million tonnes of feed was used in Europe (Table 18). Details on theimpact that rising prices of ingredient has had on the industry is difficult to determinebecause of <strong>com</strong>pany confidentiality. A seven and 13 percent increase in revenue for2004 and 2006, respectively, were attributed to higher feed prices, was largely attributedto higher ingredient costs as raw materials account for 75 percent of feed productioncosts (Nutreco Annual Reports, 2004, 2006 and 2007; BioMar Annual Report, 2007).Table 18Key feed manufacturers and estimated industrial aquafeed production and market shareNorth Europe (NE) 1Market share in2007 (%)Feed tonnagein 2006Feed tonnagein 2007BioMar 23 300 000 316 250Ewos 30 412 500 412 500Skretting 43 500 000 591 250Others 4 37 500 55 000Total (tonnes) 1 250 000 1 375 000NE (% of total) 65 65Rest of Europe (RE) 2BioMar 18 128 250 137 000Skretting 18 128 250 130 500Provmi 9 60 750 65 250Persus 7 47 250 50 750Didaq 6 40 500 43 500Aller Aqua 5 33 750 36 250Feedus 4 27 000 29 000Others 33 209 250 239 250Total (tonnes) 675 000 725 000RE (% of total) 35 35Total aquafeeds in NE + RE (tonnes) 1 925 000 2 100 0001NE = Norway, Scotland, Ireland and Faroe Islands2RE = >1000 tonnes: Denmark, Finland, France, Greece, Italy, Poland, Spain, Sweden, Germany, the RussianFederation, Turkey, Czech Republic, Croatia, Switzerland, the NetherlandsSource: Estimates extrapolated from BioMar Annual Report (2008).