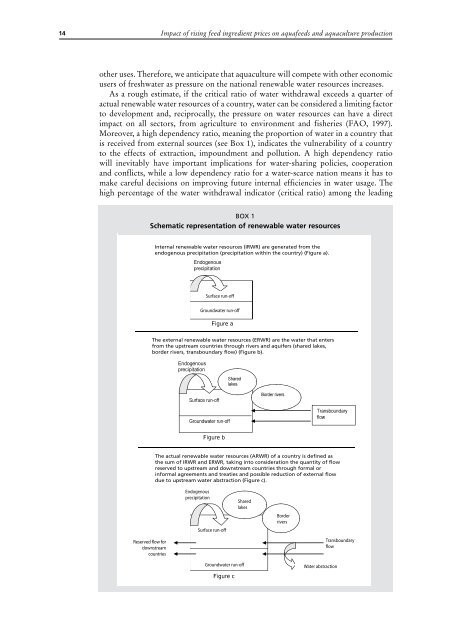
14Impact of rising feed ingredient prices on aquafeeds and aquaculture productionother uses. Therefore, we anticipate that aquaculture will <strong>com</strong>pete with other economicusers of freshwater as pressure on the national renewable water resources increases.As a rough estimate, if the critical ratio of water withdrawal exceeds a quarter ofactual renewable water resources of a country, water can be considered a limiting factorto development and, reciprocally, the pressure on water resources can have a directimpact on all sectors, from agriculture to environment and fisheries (FAO, 1997).Moreover, a high dependency ratio, meaning the proportion of water in a country thatis received from external sources (see Box 1), indicates the vulnerability of a countryto the effects of extraction, impoundment and pollution. A high dependency ratiowill inevitably have important implications for water‐sharing policies, cooperationand conflicts, while a low dependency ratio for a water-scarce nation means it has tomake careful decisions on improving future internal efficiencies in water usage. Thehigh percentage of the water withdrawal indicator (critical ratio) among the leadingBox 1Schematic representation of renewable water resourcesInternal renewable water resources (IRWR) are generated from theendogenous precipitation (precipitation within the country) (Figure a).Surface run-offGroundwater run-offFigure aThe external renewable water resources (ERWR) are the water that entersfrom the upstream countries through rivers and aquifers (shared lakes,border rivers, transboundary flow) (Figure b).Figure bThe actual renewable water resources (ARWR) of a country is defined asthe sum of IRWR and ERWR, taking into consideration the quantity of flowreserved to upstream and downstream countries through formal orinformal agreements and treaties and possible reduction of external flowdue to upstream water abstraction (Figure c).EndogenousprecipitationSurface run-offSharedlakesBorderriversReserved flow fordownstreamcountriesTransboundaryflowGroundwater run-offFigure cWater abstraction
Assessment of aquaculture production with special reference to Asia and Europe15Table 14Some possible indicators for sustainable water resources development in leading aquacultureproducing countries in AsiaCountrySome possible indicators for sustainable water resources developmentInternal renewablewater resources (IRWR)(million m 3 )Actual renewablewater resources(ARWR) (million m 3 )% waterwithdrawalfrom ARWRDependencyratioChina 2 812 000 2 829 600 22.3 0.6India 1261000 1 896 700 34.0 33.5Indonesia 2 838 000 2 838 000 3.0 00Philippines 479 000 479 000 6.0 00Bangladesh 105 000 1 210 600 6.5 91.3Thailand 210 000 409 900 21.2 48.8Japan 430 000 430 000 20.6 00Taiwan Province of China 67 000 67 000 - 00Viet Nam 366 500 891 200 8.0 58.9Source: Adapted from WRI (2008).aquaculture countries in Asia, points to a possible water limiting factor for aquaculturedevelopment in China, India, Thailand and Japan and the high dependency ratioindicator for Bangladesh and Viet Nam may suggest increased <strong>com</strong>petition from othersectors and countries with which they share this resource (Table 14).In the light of probable increased <strong>com</strong>petition for land and water throughout manyaquaculture producing countries in Asia, there will inevitably be increasing pressureto improve productivity through intensification. This trend is already evident. Theproduction of low-value (in marketing term) herbivore and omnivore species is changingrapidly from extensive to semi-intensive systems using low‐cost farm-made aquafeeds.This is illustrated by the recent trend in global aquafeed production and number offarms dependent on aquafeeds. In 2003, global aquafeed production was estimatedat approximately 19.5 million tonnes, but it is anticipated that it would increase toover 37.0 million tonnes by the end of this decade (Barlow, 2000). According to anestimate based on the aquafeed production of the seven leading aquaculture producingcountries (Bangladesh, China, India, Indonesia, the Philippines, Thailand and VietNam), this trend was also evident from the increase in the use of industrial aquafeedsfrom 10.3 million tonnes in 2003 to an estimated 22.2 million tonnes in 2013 in Asiaalone (De Silva and Hasan, 2007).It is also predicted that the usage of farm-made aquafeeds may go up over the nextten years, to 30.7 million tonnes in 2013 from 19.3 million tonnes, representing a growthof 60 percent from the 2003 level (De Silva and Hasan, 2007). In a recent analysis basedon case studies in six leading Asian aquaculture producing countries, 50–70 percent offarms, with the exception of China, were dependent on farm-made aquafeeds. China’sdependency was only 25 percent. The number of semi-intensive farms depending on<strong>com</strong>plete <strong>com</strong>mercial feeds is highest in India (74 percent) followed by China (46 percent)(Rola and Hasan, 2007). China and India together accounted for 90 percent of the world’scarp and other cyprinid production, and 92 percent of Asia’s carp and other cyprinidproduction, indicating a trend towards the mainstay of low-value species but semiintensivefarming using <strong>com</strong>mercial <strong>com</strong>plete feeds as opposed to feeds made on-farm.These developments suggest a trend towards increasing intensification of production andconsequently increasing dependency on formulated <strong>com</strong>plete diets.1.4 Fish consumption patterns in Asia and Europe and theimplications for the use of feed in aquacultureDuring the 1990s, global apparent consumption of fish increased. The global averageapparent per capita consumption increased from about 9 kg per year in the early 1960sto 16.3 kg in 1999 (WHO, 2002). The global per capita availability of fish and fisheryproducts has, therefore, nearly doubled in 40 years, outpacing population growth. This