Download - Intrum Justitia
Download - Intrum Justitia
Download - Intrum Justitia

Create successful ePaper yourself
Turn your PDF publications into a flip-book with our unique Google optimized e-Paper software.
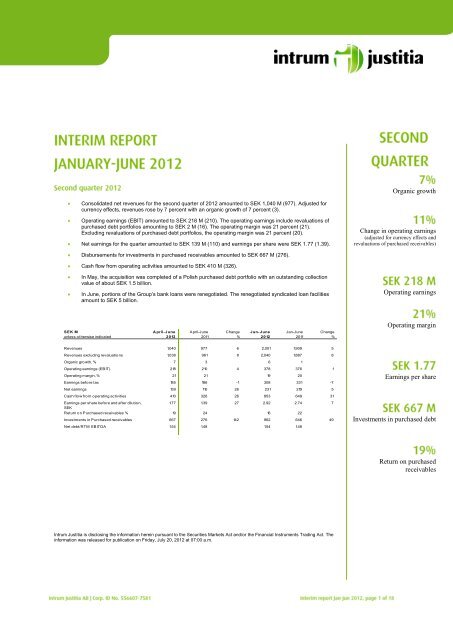
Consolidated net revenues for the second quarter of 2012 amounted to SEK 1,040 M (977). Adjusted for<br />
currency effects, revenues rose by 7 percent with an organic growth of 7 percent (3).<br />
Operating earnings (EBIT) amounted to SEK 218 M (210). The operating earnings include revaluations of<br />
purchased debt portfolios amounting to SEK 2 M (16). The operating margin was 21 percent (21).<br />
Excluding revaluations of purchased debt portfolios, the operating margin was 21 percent (20).<br />
Net earnings for the quarter amounted to SEK 139 M (110) and earnings per share were SEK 1.77 (1.39).<br />
Disbursements for investments in purchased receivables amounted to SEK 667 M (276).<br />
Cash flow from operating activities amounted to SEK 410 M (326).<br />
In May, the acquisition was completed of a Polish purchased debt portfolio with an outstanding collection<br />
value of about SEK 1.5 billion.<br />
In June, portions of the Group’s bank loans were renegotiated. The renegotiated syndicated loan facilities<br />
amount to SEK 5 billion.<br />
SEK M A pril-June April-June Change Jan-June Jan-June Change<br />
unless otherwise indicated 2012 2011 % 2012 2011 %<br />
Revenues 1,040 977 6 2,001 1,909 5<br />
Revenues excluding revaluations 1,038 961 8 2,040 1,887 8<br />
Organic growth, % 7 3 6 1<br />
Operating earnings (EBIT) 218 210 4 378 376 1<br />
Operating margin, % 21 21 19 20<br />
Earnings before tax 185 186 -1 308 331 -7<br />
Net earnings 139 110 26 231 219 5<br />
Cash flow from operating activities 410 326 26 853 649 31<br />
Earnings per share before and after dilution,<br />
SEK<br />
1.77 1.39 27 2.92 2.74 7<br />
Return on Purchased receivables % 19 24 16 22<br />
Investments in Purchased receivables 667 276 142 962 646 49<br />
Net debt/RTM EBITDA 1.54 1.48 1.54 1.48<br />
<strong>Intrum</strong> <strong>Justitia</strong> is disclosing the information herein pursuant to the Securities Markets Act and/or the Financial Instruments Trading Act. The<br />
information was released for publication on Friday, July 20, 2012 at 07:00 a.m.<br />
Organic growth<br />
Change in operating earnings<br />
(adjusted for currency effects and<br />
revaluations of purchased receivables)<br />
Operating earnings<br />
Operating margin<br />
Earnings per share<br />
Investments in purchased debt<br />
Return on purchased<br />
receivables
The second quarter of the year brought continued positive development for <strong>Intrum</strong> <strong>Justitia</strong><br />
compared with the year-earlier period. Organic growth was 7 percent and operating earnings<br />
rose by 11 percent adjusted for currency effects and portfolio revaluations.<br />
Cash flow from operations rose by 26 percent to SEK 410 M in the second quarter and the<br />
Group’s financial position is strong. During the quarter, to be able to benefit from<br />
opportunities for expansion over the coming years, we have continued our efforts to<br />
strengthen our loan financing by extending our opportunities to borrow from banks and to<br />
improve the maturity structure of the loans.<br />
Our Financial Services service line, which focuses primarily on purchased receivables,<br />
continues to develop well. Income rose by 12 percent in the second quarter, with continued<br />
high margins and a very favorable return. The investment level in the second quarter was the<br />
highest in <strong>Intrum</strong> <strong>Justitia</strong>’s history and was mainly attributable to a high level of investment<br />
in Northern Europe.<br />
In our Credit Management service line, we are seeing a continued stable trend with a<br />
5 percent growth in revenues in the second quarter. Growth is being driven by increasing<br />
investment in purchased debt portfolios and by growth in credit management on assignment<br />
from external customers. In the short term, operating earnings will be affected negatively by<br />
continued increases in expenses for pursuing cases through the legal systems – a trend that<br />
will continue in the second half of the year. In the long term, this generates favorable<br />
conditions for strengthening profitability and increasing the stability in the return on our<br />
portfolios of purchased receivables.<br />
In our regions, Northern Europe has continued to show a positive trend in both revenues and<br />
operating earnings as a consequence of increased investments in portfolios of purchased<br />
receivables, as well as good organic growth in Credit Management. In Central Europe,<br />
earnings and margins developed favorably in the second quarter, although the level of<br />
investment in portfolios with purchased receivables was unsatisfactory. In Western Europe,<br />
we are seeing good organic growth in Credit Management but a negative impact on revenue<br />
and earnings from selectively decreased investment levels in purchased receivables as a<br />
consequence of the uncertain macro trend in several countries in the region.<br />
Work to develop our service offering in the early stages of the payment chain is continuing<br />
according to plan and towards the end of the second quarter, we launched a factoring service<br />
in the Swedish market.
SEK M A pril-June April-June Change Jan-June Jan-June Change F ull year<br />
unless otherwise indicated 2012 2011 % 2012 2011 % 2011<br />
Revenues 1,040 977 6 2,001 1,909 5 3,950<br />
Operating earnings (EBIT) 218 210 4 378 376 1 868<br />
Operating margin, % 21 21 19 20 22<br />
Net financial items -33 -24 38 -70 -45 56 -115<br />
Tax -46 -76 -39 -77 -112 -31 -200<br />
Net income 139 110 26 231 219 5 553<br />
Average number of employees 3,386 3,188 6 3,381 3,181 6 3,331<br />
The increase in revenues by 6 percent in the second quarter consists of organic growth of 7 percent,<br />
acquisition effects of 1 percent, revaluation of purchased debt of a negative 1 percent and a currency<br />
effect of 1 percent. The improved organic growth is primarily attributable to the increased investment<br />
volume in purchased receivables, but also by organic growth in credit management on assignment<br />
from external customers. Operating earnings improved by 4 percent in the second quarter, although,<br />
adjusted for currency effects and revaluations of portfolios of purchased receivables, the increase was<br />
11 percent. The improved operating earnings and operating margin are mainly attributable to a change<br />
in the mix of services, good cost control and improved internal efficiency. A more detailed<br />
description of the development of operations in the Group’s regions and service lines is provided<br />
below.<br />
Net financial items for the quarter amounted to an expense of SEK 33 (24). The increase is mainly<br />
explained by increased loan volumes. In addition, exchange rate differences have affected net<br />
financial items by SEK 0 M (neg 2), and other financial items had a negative effect of SEK 7 M<br />
(neg 3).<br />
Earnings for the quarter were charged with tax of 25 percent, corresponding to the estimated average<br />
tax cost for the 2012 full year. Taxes for the second quarter 2011 included a one-off cost of SEK 29<br />
M attributable to a dispute in Finland. Further information on ongoing tax disputes is provided in the<br />
section “Taxation assessments”.<br />
Cash flow from operating activities over the quarter amounted to SEK 410 M (326). The increase<br />
compared with the preceding year is primarily attributable to improved operating earnings, excluding<br />
depreciation and amortization. Disbursements during the quarter for investments in purchased<br />
receivables amounted to SEK 667 M (276).<br />
SEK M A pril-June April-June Change<br />
unless otherwise indicated 2012 2011 %<br />
Net Debt 3,231 2,578 25<br />
Net debt/RTM EBITDA 1.54 1.48<br />
Shareholders' equity 2,685 2,534 6<br />
Liquid assets 419 356 18
The increase in consolidated net debt is compared with the year-earlier period is primarily attributable<br />
to a high level of investment in purchased receivables. Thanks to a favorable earnings trend and<br />
strong cash flow, consolidated net debt in relation to operating earnings before depreciation and<br />
amortization was at a relatively unchanged and low level of 1.54.<br />
In June, portions of the Group’s bank loans were renegotiated with the purpose of improving the<br />
structure of the Group’s long-term financing. The renegotiated syndicated loan facilities amount to<br />
SEK 5 billion, of which approximately SEK 2 billion has been utilized at the end of the quarter. The<br />
new bank financing entails a more flexible maturity structure whereby the loan, including a bond loan<br />
of SEK 1 billion, matures in an amount of SEK 2 billion per year over the period 2015-2017. For its<br />
short-term financing, the Group uses a commercial paper program involving borrowing of SEK<br />
615 M as per June 30, 2012.<br />
Consolidated goodwill amounted to SEK 2,405 M compared with SEK 2,204 M as per December 31,<br />
2011. The change was attributable to the acquisition in the first quarter for SEK 224 M and net<br />
negative exchange rate differences of SEK 23 M.<br />
SEK M A pril-June April-June Change Jan-June Jan-June Change F ull Year<br />
2012 2011 % 2012 2011 % 2011<br />
Revenues 487 440 11 942 848 11 1,777<br />
Operating earnings 120 117 3 233 202 15 453<br />
Revenues excluding revaluations 486 428 14 939 834 13 1,759<br />
Operating earnings excluding revaluations 119 105 13 230 188 22 435<br />
Operating margin excluding revaluations, % 24 25 24 23 25<br />
Revenues for the quarter rose by 15 percent and operating earnings improved by 13 percent adjusted<br />
for currency effects and revaluations, compared with the year-earlier period. The strong growth in<br />
revenues in the region is driven by continued high investment levels in purchased receivables and a<br />
favorable trend in the Credit Management operations. Operating earnings are developing well through<br />
organic improvements, as well as positive effects from acquired operations in previous years, where<br />
the operating earnings for the second quarter of 2011 were burdened by integration costs of SEK 5 M.<br />
Costs for legal collection measures in the region continue to rise compared with last year, which has<br />
had a short-term negative impact on earnings.<br />
SEK M A pril-June April-June Change Jan-June Jan-June Change F ull Year<br />
2012 2011 % 2012 2011 % 2011<br />
Revenues 222 211 5 462 422 9 906<br />
Operating earnings 41 32 28 89 73 22 200<br />
Revenues excluding revaluations 221 208 6 462 414 12 899<br />
Operating earnings excluding revaluations 40 29 38 89 65 37 193<br />
Operating margin excluding revaluations, % 18 14 19 16 21<br />
Revenues for the quarter rose by 6 percent and operating earnings improved by 32 percent, adjusted<br />
for currency effects and revaluations, compared with the year-earlier period. High levels of<br />
investment in purchased receivables in 2011 and a stable trend in Credit Management have<br />
contributed to the improved earnings. To compensate for decreased volumes in aging portfolios and<br />
to strengthen the market position, mainly in Germany, the region continues to focus on increasing<br />
volumes in purchased receivables.
SEK M A pril-June April-June Change Jan-June Jan-June Change F ull Year<br />
2012 2011 % 2012 2011 % 2011<br />
Revenues 331 326 2 597 639 -7 1,267<br />
Operating earnings 57 62 -8 56 111 -50 224<br />
Revenues excluding revaluations 331 325 2 639 639 0 1,273<br />
Operating earnings excluding revaluations 57 61 -7 98 111 -12 230<br />
Operating margin excluding revaluations, % 17 19 15 17 18<br />
Revenues for the quarter rose by 3 percent and operating earnings decreased by 4 percent, adjusted<br />
for currency effects and revaluations, compared with the year-earlier period. The positive income<br />
trend is among others due to good volume development in Credit Management and the acquired unit<br />
in the Netherlands. The uncertain macroeconomic situation affects both revenues and operating<br />
earnings negatively as the uncertainty has had the consequence of the region having selectively<br />
reduced its investments in purchased receivables. Furthermore, operating earnings were negatively<br />
impacted by increasing costs of collection, something that <strong>Intrum</strong> <strong>Justitia</strong> is unable to compensate for<br />
in terms of volumes in the current market. Operating earnings were positively impacted by a nonrecurring<br />
effect of around SEK 7 M during the second quarter.<br />
SEK M A pril-June April-June Change Jan-June Jan-June Change F ull Year<br />
2012 2011 % 2012 2011 % 2011<br />
Revenues 854 812 5 1,691 1,598 6 3,293<br />
Service line earnings 197 196 1 395 388 2 843<br />
Service line margin, % 23 24 23 24 26<br />
Adjusted for currency effects, revenues rose by 6 percent in the quarter, while operating earnings<br />
were unchanged compared with the preceding year. The positive trend from both the fourth quarter of<br />
2011 and the first quarter of 2012 in terms of organic growth has also continued in the second quarter.<br />
Operating earnings were affected negatively by increased costs for collection measures.<br />
SEK M A pril-June April-June Change Jan-June Jan-June Change F ull Year<br />
2012 2011 % 2012 2011 % 2011<br />
Revenues 312 279 12 553 517 7 1,088<br />
Service line earnings 166 156 6 272 282 -4 591<br />
Service line margin, % 53 56 49 55 54<br />
Return on Purchased receivables, % 19 24 16 22 21<br />
Investments in Purchased receivables 667 276 142 962 646 49 1,804<br />
Carrying amount, Purchased Receivables 3,625 2,646 37 3,625 2,646 37 3,229<br />
Activity in the procurement of portfolios of purchased receivables is good and investments for the<br />
quarter were the highest in <strong>Intrum</strong> <strong>Justitia</strong>’s history as a consequence of an acquisition of a large<br />
Polish bank portfolio and favorable activity in the procurement of small and medium-sized portfolios.<br />
The acquisition of the Polish bank portfolio was completed in June, meaning that the transaction will<br />
have an effect of operating earnings as of the third quarter. The portfolio has an outstanding value of<br />
about SEK 1.5 billion. The return of the portfolio is negatively impacted by the fact that the Polish<br />
banking portfolio has been included in the reported value, but without having had any effect on the<br />
operating result.<br />
For a description of <strong>Intrum</strong> <strong>Justitia</strong>’s accounting principle for purchased receivables, please see page<br />
56-57 of the Annual Report 2011.
Europe is characterized by considerable regional differences and there is substantial uncertainty<br />
regarding the macroeconomic situation in several countries. In a substantially weakened<br />
macroeconomic situation in Europe, with increased unemployment, <strong>Intrum</strong> <strong>Justitia</strong> is negatively<br />
affected.<br />
In <strong>Intrum</strong> <strong>Justitia</strong>’s view, the Group’s strategic focus is well attuned to the market trend, with a<br />
broadening of credit management services and a link to risk reduction and financial services based on<br />
strong, market-leading collection operations. Companies’ need to generate stronger and more<br />
predictable cash flow is increasing, as is the need to create additional alternatives for the financing of<br />
working capital, for example by selling receivables. These are trends that, in the long term, will<br />
benefit <strong>Intrum</strong> <strong>Justitia</strong>.<br />
Following a tax audit of the Group’s Swedish parent company for the 2009 financial year, the<br />
Swedish National Tax Board decided to impose a tax surcharge of SEK 19 M in 2011. <strong>Intrum</strong> <strong>Justitia</strong><br />
takes the view, however, that its tax returns contained no misstatements and that the conditions for a<br />
tax surcharge have therefore not been met. Consequently, the company has appealed the ruling with<br />
regard to the tax surcharge and has not made any provision for this cost.<br />
In connection with a tax audit in Belgium in 2011, the company’s right to make so-called notional<br />
interest deductions was brought into question. The company is discussing the matter with the tax<br />
authorities but risks, in the worst-case scenario, being liable to pay additional tax for 2008 and 2009<br />
as well as a tax surcharge and interest totaling EUR 10 M. In the opinion of the company, the tax<br />
authorities’ assessment is incorrect since it refers to legal cases regarding situations different from<br />
that at hand. Consequently, <strong>Intrum</strong> <strong>Justitia</strong> has not made any provisions for additional taxes.<br />
In the second quarter of 2012, <strong>Intrum</strong> <strong>Justitia</strong> has not had cause to change its view of the most likely<br />
outcome of the ongoing tax disputes and has not therefore made any provisions for additional tax<br />
expenses in the closing account for the quarter.<br />
The Group’s publicly listed Parent Company, <strong>Intrum</strong> <strong>Justitia</strong> AB (publ), owns the subsidiaries,<br />
provides the Group’s head office functions and handles certain Group-wide development work,<br />
services and marketing.<br />
The Parent Company reported net revenues of SEK 36 M (35) for the six-month period and earnings<br />
before tax of SEK -78 M (-47). During the period the Parent Company invested SEK 0 M (0) in fixed<br />
assets and had liquid assets of SEK 187 M (65) at the end of the period. The average number of<br />
employees was 39 (30).<br />
This interim report has been prepared in accordance with the Annual Accounts Act and IAS 34<br />
Interim Financial Reporting for the Group and in accordance with Chapter 9 of the Annual Accounts<br />
Act for the Parent Company. The same accounting principles and calculation methods have been<br />
applied as in the most recent Annual Report.<br />
The Group’s and the Parent Company’s risks include strategic risks related to economic<br />
developments and acquisitions as well as operational risks related to, among other things, possible<br />
errors and omissions as well as operations in different countries. Moreover, there are risks related to<br />
the regulatory environment and financial risks such as market risk, financing risk, credit risk, risks
inherent in purchased receivables and guarantees in conjunction with the screening of charge card<br />
applications. The risks are described in more detail in the Board of Directors’ report in <strong>Intrum</strong><br />
<strong>Justitia</strong>’s 2011 Annual Report. No significant risks are considered to have arisen besides those<br />
described in the Annual Report.<br />
The interim report and presentation material are available at www.intrum.com > Investor relations.<br />
President & CEO Lars Wollung and Chief Financial Officer Erik Forsberg will comment on the<br />
report at a teleconference today, starting at 9:00 a.m. CET. The presentation can be followed at<br />
www.intrum.com and/or www.financialhearings.com. To participate by phone, call +46 (0)8 505 597<br />
72 (SE) or +44 (0)20 710 862 05 (UK).<br />
Lars Wollung, President & CEO <strong>Intrum</strong> <strong>Justitia</strong> AB (publ) Tel: +46 (0)8-546 10 202<br />
Erik Forsberg, Chief Financial Officer, tel.: +46 (0)8-546 10 202<br />
Annika Billberg, IR & Communications Director, tel.: +46 (0)8-545 10 203, mobile: +46 (0)70 267<br />
9791
The interim report for January-September will be published October 24, 2012<br />
The year-end report for 2012 will be published February 5, 2013<br />
This interim report has not been reviewed by the company’s auditors.<br />
The interim report and other financial information are available at <strong>Intrum</strong> <strong>Justitia</strong>’s website: www.intrum.com<br />
Denna delårsrapport finns även på svenska.<br />
The Board of Directors and the President provide their assurance that this interim report provides an accurate overview of the<br />
operations, position and earnings of the Group and the Parent Company, and that it also describes the principal risks and<br />
sources of uncertainty faced by the Parent Company and its subsidiaries.<br />
Stockholm, July 20, 2012<br />
Lars Lundquist Matts Ekman Helen Fasth-Gillstedt<br />
Chairman of the Board Board member Board member<br />
Joakim Rubin Charlotte Strömberg Fredrik Trägårdh Joakim Westh<br />
Board member Board member Board member Board member<br />
Lars Wollung<br />
President and CEO<br />
<strong>Intrum</strong> <strong>Justitia</strong> is Europe’s leading Credit Management Services (CMS) group, offering<br />
comprehensive credit management services, including Purchased Debt, designed to measurably<br />
improve clients’ cash flows and long-term profitability. Founded in 1923, <strong>Intrum</strong> <strong>Justitia</strong> has some<br />
3,300 employees in 20 markets. Consolidated revenues amounted to SEK 4 billion in 2011. <strong>Intrum</strong><br />
<strong>Justitia</strong> AB has been listed on the NASDAQ OMX Stockholm exchange since 2002. For further<br />
information, please visit www.intrum.com.
SEK M A pril-June April-June Jan-June Jan-June Full Year<br />
2012 2011 2012 2011 2011<br />
Revenues 1,040 977 2,001 1,909 3,950<br />
Cost of sales -635 -587 -1,259 -1,158 -2,363<br />
Gro ss earnings 405 390 742 751 1,587<br />
Sales and marketing expenses -61 -63 -119 -128 -243<br />
General and administrative expenses -127 -117 -245 -239 -470<br />
Disposal of shares in associated company 0 -1 0 -9 -9<br />
Participation in associated companies 1 1 0 1 3<br />
Operating earnings (EB IT ) 218 210 378 376 868<br />
Net financial items -33 -24 -70 -45 -115<br />
Earnings befo re tax 185 186 308 331 753<br />
Tax -46 -76 -77 -112 -200<br />
N et inco me fo r the perio d 139 110 231 219 553<br />
Of which attributable to :<br />
Parent company's shareholders 141 110 233 218 552<br />
Non-controlling interest -2 0 -2 1 1<br />
N et earnings fo r the perio d 139 110 231 219 553<br />
Earnings per share before and after dilution 1.77 1.39 2.92 2.74 6.91<br />
SEK M A pril-June April-June Jan-June Jan-June Jan-June<br />
2012 2011 2012 2011 2011<br />
Net income for the period 139 110 231 219 553<br />
Currency translation difference 1 46 0 66 11<br />
C o mprehensive inco me fo r the perio d 140 156 231 285 564<br />
Of which attributable to :<br />
Parent company's shareholders 142 156 233 284 562<br />
Non-controlling interest -2 0 -2 1 2<br />
C o mprehensive inco me fo r the perio d 140 156 231 285 564
SEK M 30 Jun 30 Jun 31 Dec<br />
ASSETS<br />
Intangible fixed assets<br />
Capitalized expenditure for IT development and other<br />
intangibles<br />
2012 2011 2011<br />
281 305 307<br />
Client relationships 112 139 102<br />
Goodwill 2,405 2,193 2,204<br />
T o tal intangible fixed assets 2,798 2,637 2,613<br />
T angible fixed assets 66 70 66<br />
Other fixed assets<br />
Shares and participations in associated companies and<br />
other companies<br />
11 12 12<br />
Purchased receivables 3,625 2,646 3,229<br />
Deferred tax assets 71 76 71<br />
Other long-term receivables 23 46 32<br />
T o tal o ther fixed assets 3,730 2,780 3,344<br />
T o tal fixed assets 6,594 5,487 6,023<br />
Current Assets<br />
Accounts receivable 269 274 266<br />
Client funds 461 583 580<br />
Tax assets 28 55 28<br />
Other receivables 287 303 266<br />
Prepaid expenses and accrued income 164 127 119<br />
Cash and cash equivalents 419 356 625<br />
T o tal current assets 1,628 1,698 1,884<br />
TOTAL ASSETS 8,222 7,185 7,907<br />
SHAREHOLDERS' EQUITY AND LIABILITIES<br />
Attributable to parent company's shareholders 2,685 2,533 2,811<br />
Attributable to non-controlling interest 0 1 2<br />
T o tal shareho lders' equity 2,685 2,534 2,813<br />
Long-term liabilities<br />
Liabilities to credit institutions 1,930 2,827 2,588<br />
M edium term note 987 - -<br />
Other long-term liabilities 229 65 61<br />
Provisions for pensions 47 39 46<br />
Other long-term provisions 3 12 3<br />
Deferred tax liabilities 95 74 89<br />
T o tal lo ng-term liabilities 3,291 3,017 2,787<br />
Current liabilities<br />
Liabilities to credit institutions 20 2 5<br />
Commercial paper 615 - 617<br />
Client funds payable 461 583 580<br />
Accounts payable 138 116 133<br />
Income tax liabilities 191 216 203<br />
Advances from clients 23 28 27<br />
Other current liabilities 267 206 229<br />
Accrued expenses and prepaid income 526 474 505<br />
Other short-term provisions 5 9 8<br />
T o tal current liabilities 2,246 1,634 2,307<br />
TOTAL SHAREHOLDERS' EQUITY AND<br />
LIABILITIES<br />
8,222 7,185 7,907
SEK M 2012 2011<br />
Attributable to<br />
Parent<br />
Company's<br />
shareholders<br />
Non-controlling<br />
interest T o tal<br />
Attributable to<br />
Parent<br />
Company's<br />
shareholders<br />
Non-controlling<br />
interest T o tal<br />
Opening B alance, January 1 2,811 2 2,813 2,576 0 2,576<br />
Dividend -359 -359 -327 -327<br />
Comprehensive income for the period 233 -2 231 284 1 285<br />
C lo sing B alance, June 30 2,685 0 2,685 2,533 1 2,534<br />
SEK M A pril-June April-June Jan-June Jan-June F ull Year<br />
2012 2011 2012 2011 2011<br />
Operating activities<br />
Operating earnings (EBIT) 218 210 378 376 868<br />
Depreciation/amortization 44 42 86 85 173<br />
Amortization/revaluation of purchased receivables 275 190 568 386 888<br />
Adjustment for expenses not included in cash flow -2 -2 0 5 9<br />
Interest received 2 4 10 9 22<br />
Interest paid and other financial expenses -30 -25 -65 -45 -99<br />
Income tax paid -40 -65 -89 -129 -177<br />
C ash flo w fro m o perating activities befo re<br />
changes in wo rking capital<br />
467 354 888 687 1,684<br />
Changes in working capital -57 -28 -35 -38 84<br />
C ash flo w fro m o perating activities 410 326 853 649 1,768<br />
Investing activities<br />
Purchases of tangible and intangible fixed assets -37 -27 -64 -48 -120<br />
Debt purchases -667 -276 -962 -646 -1,804<br />
Purchases of shares in subsidiaries and other companies 0 -1 -69 -1 -43<br />
Disposals of shares in subsidiaries and associated<br />
companies<br />
0 0 0 3 3<br />
Other cash flow from investing activities 5 5 10 9 18<br />
C ash flo w fro m investing activities -699 -299 -1,085 -683 -1,946<br />
Financing activities<br />
Borrowings and repayment of loans 361 341 381 199 624<br />
Share dividend to Parent Company's shareholders -359 -327 -359 -327 -327<br />
C ash flo w fro m financing activities 2 14 22 -128 297<br />
C hange in liquid assets -287 41 -210 -162 119<br />
Opening balance o f liquid assets 706 295 625 507 507<br />
Exchange rate differences in liquid assets 0 20 4 11 -1<br />
C lo sing balance o f liquid assets 419 356 419 356 625
Quarter 2 Quarter 1 Quarter 4 Quarter 3 Quarter 2<br />
2012 2012 2011 2011 2011<br />
Revenues, SEK M 1,040 961 1,042 998 977<br />
Revenue growth, % 6 3 8 8 6<br />
Organic growth, % 7 6 5 3 3<br />
Operating earnings (EBIT), M SEK 218 160 228 263 210<br />
Operating earnings excluding revaluations, M SEK 216 200 234 260 194<br />
Operating margin excluding revaluations, % 21 20 22 26 20<br />
EBITDA, M SEK 537 496 527 540 457<br />
2012 2011 2010 2009 2008<br />
A pril-June April-June April-June April-June April-June<br />
Revenues, SEK M 1,040 977 922 1,051 891<br />
Revenue growth, % 6 6 -12 18 13<br />
Organic growth, % 7 3 -1 4 11<br />
Operating earnings (EBIT), SEK M 218 210 181 158 180<br />
Operating earnings (EBIT) excl revaluations, SEK M 216 194 180 164 179<br />
Operating margin excl revaluations, % 21 20 20 16 20<br />
EBITDA, SEK M 537 457 417 409 380<br />
Earnings before tax, SEK M 185 186 151 140 149<br />
Net income, SEK M 139 110 85 105 112<br />
Net debt, SEK M 3,231 2,578 1,923 2,701 2,311<br />
Shareholders' equity, SEK M 2,685 2,534 2,387 2,358 1,767<br />
Net debt/equity 120 102 81 115 131<br />
Net debt/EBITDA RTM 1.54 1.48 1.16 1.72 1.65<br />
Interest coverage 6.2 7.6 5.8 7.2 5.2<br />
Earnings per share, SEK 1.77 1.39 1.07 1.32 1.42<br />
Equity per share, SEK 33.67 31.76 29.47 29.57 22.32<br />
Average number of shares, '000 79,745 79,745 79,745 79,650 79,103<br />
Number of shares outstanding at end of period, '000 79,745 79,745 79,745 79,745 79,141<br />
Return on purchased receivables, % 19 23 19 16 16<br />
Investments in purchased receivables, SEK M 667 276 198 369 251<br />
Average number of employees 3,386 3,188 3,115 3,416 3,157<br />
2011 2010 2009 2008 2007<br />
F ull Year Full Year Full Year Full Year Full Year<br />
Revenues, SEK M 3,950 3,766 4,128 3,678 3,225<br />
Revenue growth, % 5 -9 12 14 10<br />
Organic growth, % 2 -1 4 9 10<br />
Operating earnings (EBIT), SEK M 868 731 668 697 668<br />
Operating earnings (EBIT) excl revaluations, SEK M 849 727 704 695 656<br />
Operating margin excl revaluations, % 22 19 17 19 20<br />
EBITDA, SEK M 1,929 1,702 1,650 1,473 1,243<br />
Earnings before tax, SEK M 753 639 588 570 596<br />
Net income, SEK M 553 452 441 442 462<br />
Net debt, SEK M 2,692 2,193 2,069 2,348 1,527<br />
Shareholders' equity, SEK M 2,813 2,577 2,549 2,395 1,843<br />
Net debt/equity 96 85 81 98 83<br />
Net debt/EBITDA RTM 1.40 1.29 1.25 1.59 1.23<br />
Interest coverage 6.5 7.2 7.6 4.6 7.5<br />
Earnings per share, SEK 6.91 5.67 5.53 5.58 5.86<br />
Equity per share, SEK 35.26 32.21 31.96 30.19 23.30<br />
Dividend per share, SEK 4.50 4.10 3.75 3.50 3.25<br />
Average number of shares, '000 79,745 79,745 79,745 79,446 79,567<br />
Number of shares outstanding at end of period, '000 79,745 79,745 79,745 79,592 79,090<br />
Return on purchased receivables, % 21 18 18 19 20<br />
Investments in purchased receivables, SEK M 1,804 1,050 871 1,204 666<br />
Average number of employees 3,331 3,099 3,372 3,318 3,093
SEK M A pril-June April-June Change Jan-June Jan-June Change F ull Year<br />
2012 2011 % 2012 2011 % 2011<br />
Northern Europe 487 440 11 942 848 11 1,777<br />
Central Europe 222 211 5 462 422 9 906<br />
Western Europe 331 326 2 597 639 -7 1,267<br />
T o tal revenues fro m external clients 1,040 977 6 2,001 1,909 5 3,950<br />
SEK M A pril-June April-June Change Jan-June Jan-June Change F ull Year<br />
2012 2011 % 2012 2011 % 2011<br />
Northern Europe 37 30 23 72 54 33 116<br />
Central Europe 48 42 14 100 82 22 192<br />
Western Europe 22 23 -4 42 47 -11 92<br />
Eliminations -107 -95 13 -214 -183 17 -400<br />
T o tal interco mpany revenues 0 0 0 0 0<br />
SEK M A pril-June April-June Jan-June Jan-June F ull Year<br />
2012 2011 2012 2011 2011<br />
Northern Europe 1 12 3 14 18<br />
Central Europe 1 3 0 8 7<br />
Western Europe 0 1 -42 0 -6<br />
T o tal revaluatio n 2 16 -39 22 19<br />
SEK M A pril-June April-June Change Jan-June Jan-June Change F ull Year<br />
2012 2011 % 2012 2011 % 2011<br />
Northern Europe 486 428 14 939 834 13 1,759<br />
Central Europe 221 208 6 462 414 12 899<br />
Western Europe 331 325 2 639 639 0 1,273<br />
T o tal revenues excluding revaluatio ns 1,038 961 8 2,040 1,887 8 3,931
SEK M A pril-June April-June Jan-June Jan-June F ull Year<br />
2012 2011 2012 2011 2011<br />
Northern Europe -1 -1 -2 -2 -4<br />
Central Europe 0 0 0 0 0<br />
Western Europe -4 -3 -7 -6 -13<br />
T o tal amo rtizatio n and impairment -5 -4 -9 -8 -17<br />
SEK M A pril-June April-June Change Jan-June Jan-June Change F ull Year<br />
2012 2011 % 2012 2011 % 2011<br />
Northern Europe 120 117 3 233 202 15 453<br />
Central Europe 41 32 28 89 73 22 200<br />
Western Europe 57 62 -8 56 111 -50 224<br />
Loss on disposal of shares in associated<br />
company<br />
- -1 - - -9 - -8<br />
Participation in Iceland - 0 - - -1 - -1<br />
T o tal o perating earnings (EB IT ) 218 210 4 378 376 1 868<br />
Net financial items -33 -24 38 -70 -45 56 -115<br />
Earnings befo re tax 185 186 -1 308 331 -7 753<br />
SEK M A pril-June April-June Change Jan-June Jan-June Change F ull Year<br />
2012 2011 % 2012 2011 % 2011<br />
Northern Europe 119 105 13 230 188 22 435<br />
Central Europe 40 29 38 89 65 37 193<br />
Western Europe 57 61 -7 98 111 -12 230<br />
Loss on disposal of shares in asscciated<br />
company<br />
- -1 - - -9 - -8<br />
Participation in Iceland - 0 - - -1 - -1<br />
T o tal o perating earnings excluding<br />
revaluatio ns<br />
216 194 11 417 354 18 849<br />
% A pril-June April-June Jan-June Jan-June F ull Year<br />
2012 2011 2012 2011 2011<br />
Northern Europe 24 25 24 23 25<br />
Central Europe 18 14 19 16 21<br />
Western Europe 17 19 15 17 18<br />
Operating margin fo r the Gro up 21 20 20 19 22
SEK M A pril-June April-June Change Jan-June Jan-June Change F ull Year<br />
2012 2011 % 2012 2011 % 2011<br />
Credit M anagement 854 812 5 1,691 1,598 6 3,293<br />
Financial services 312 279 12 553 517 7 1,088<br />
Elimination of inter-service line revenue -126 -114 11 -243 -206 18 -431<br />
T o tal revenues 1,040 977 6 2,001 1,909 5 3,950<br />
SEK M A pril-June April-June Change Jan-June Jan-June Change F ull Year<br />
2012 2011 % 2012 2011 % 2011<br />
External Credit M anagement revenues 728 698 4 1,448 1,392 4 2,862<br />
Collections on purchased receivables 574 472 22 1,098 897 22 1,930<br />
Amortization of purchased receivables -277 -219 26 -530 -421 26 -907<br />
Revaluation of purchased receivables 2 16 - -39 22 - 19<br />
Other revenues from financial services 13 10 30 24 19 26 46<br />
T o tal revenues 1,040 977 6 2,001 1,909 5 3,950<br />
SEK M A pril-June April-June Change Jan-June Jan-June Change F ull Year<br />
2012 2011 % 2012 2011 % 2011<br />
Credit M anagement 197 196 1 395 388 2 843<br />
Financial services 166 156 6 272 282 -4 591<br />
Common costs -145 -141 3 -289 -294 -2 -566<br />
T o tal o perating earnings 218 211 3 378 376 1 868<br />
% A pril-June April-June Jan-June Jan-June F ull Year<br />
2012 2011 2012 2011 2011<br />
Credit M anagement 23 24 23 24 26<br />
Financial services 53 56 49 55 54<br />
Operating margin fo r the Gro up 21 21 19 20 22
SEK M Jan-June Jan-June Full Year<br />
2012 2011 2011<br />
Revenues 36 35 75<br />
Gro ss earnings 36 35 75<br />
Sales and marketing expenses -8 -7 -15<br />
General and administrative expenses -68 -70 -140<br />
Operating earnings (EB IT ) -40 -42 -80<br />
Income from subsidiaries 0 0 97<br />
Net financial items -38 -5 -35<br />
Earnings befo re tax -78 -47 -18<br />
Tax 0 0 0<br />
N et earnings fo r the perio d -78 -47 -18<br />
SEK M Jan-June Jan-June Full Year<br />
2012 2011 2011<br />
Net earnings for the period -78 -47 -18<br />
Other comprehensive income: Change of translation<br />
reserve<br />
59 -29 21<br />
T o tal co mprehensive inco me -19 -76 3<br />
SEK M 30 Jun 30 Jun 31 Dec<br />
A SSET S<br />
F ixed assets<br />
2012 2011 2011<br />
Intangible fixed assets 1 1 1<br />
Tangible fixed assets 1 1 1<br />
Financial fixed assets 7,501 7,161 7,717<br />
T o tal fixed assets 7,503 7,163 7,719<br />
C urrent assets<br />
Current receivables 2,389 2,331 2,473<br />
Cash and bank balances 187 65 272<br />
T o tal current assets 2,576 2,396 2,745<br />
T OT A L A SSET S 10,079 9,559 10,464<br />
SH A R EH OLD ER S' EQUIT Y A N D<br />
LIA B ILIT IES<br />
Restricted equity 284 284 284<br />
Unrestricted equity 4,198 4,499 4,577<br />
T o tal shareho lders' equity 4,482 4,783 4,861<br />
Provisions 0 5 0<br />
Long-term liabilities 3,891 3,690 3,807<br />
Current liabilities 1,706 1,081 1,796<br />
T OT A L SH A R EH OLD ER S* EQUIT Y A N D<br />
LIA B ILIT IES<br />
10,079 9,559 10,464<br />
Pledged assets None None None<br />
Contingent liabilities 87 None 90
120<br />
110<br />
100<br />
90<br />
80<br />
70<br />
60<br />
50<br />
30 June 2012<br />
<strong>Intrum</strong> <strong>Justitia</strong> OMXS<br />
N o o f<br />
shares C apital and<br />
Vo tes, %<br />
Fidelity Investment M anagement 7,981,067 10.0<br />
Lannebo Funds 4,482,536 5.6<br />
Carnegie Funds 4,063,000 5.1<br />
CapM an Oyj 3,607,550 4.5<br />
Government of Norway 2,712,359 3.4<br />
State of New Jersey Pension Fund 2,500,000 3.1<br />
SEB Funds 2,352,565 3.0<br />
First Swedish National Pension Fund 2,316,939 2.9<br />
Swedbank Robur Funds 2,276,737 2.9<br />
Fourth Swedish National Pension Fund 2,248,891 2.8<br />
SHB Funds 1,593,766 2.0<br />
Horn Fjarfestingarfelag ehf 1,529,784 1.9<br />
Confederation of Swedish Enterprise 1,500,000 1.9<br />
Invesco Funds 1,341,517 1.7<br />
Odin Funds 1,175,966 1.5<br />
T o tal, fifteen largest shareho lders 41,682,677 52.3<br />
T o tal number o f shares: 79,744,651<br />
Swedish ownership accounted for 45.3 percent (institutions 16.6 percentage points,<br />
mutual funds 22.4 percentage points, retail 6.3 percentage points) Source: SIS Aktieägarservice
Definitions<br />
Increases in revenues, operating earnings and earnings before tax refer to the percentage increase in each income statement<br />
item year-over-year.<br />
Organic growth refers to the average increase in revenues in local currency, adjusted for revaluations of portfolios of<br />
purchased receivables and the effects of acquisitions and divestments of Group companies.<br />
Consolidated revenues include variable collection commissions, fixed collection fees, debtor fees, guarantee commissions,<br />
subscription revenue and income from purchased receivables operations. Income from purchased receivables consists of<br />
collected amounts less amortization, i.e., the decrease in the portfolios’ book value for the period.<br />
Operating margin is operating earnings as a percentage of revenues.<br />
Return on purchased receivables is the service line earnings for the period, recalculated on a full-year basis, as a percentage<br />
of the average carrying amount of the balance-sheet item purchased receivables.<br />
Net debt is interest-bearing liabilities and pension provisions less liquid assets and interest-bearing receivables.<br />
Earnings before interest, taxes, depreciation and amortization are operating earnings where depreciation on fixed assets as<br />
well as amortization and revaluations of purchased receivables are added back. The figure is presented on a rolling twelve<br />
month basis, abbreviated RTM.<br />
Interest coverage ratio is earnings after financial items plus financial expenses divided by financial expenses.<br />
Service line earnings are that part of operating earnings that can be attributed to the service lines, i.e. excluding common<br />
costs for marketing and administration.<br />
Region Northern Europe comprises the Group’s activities for external clients and debtors in Denmark, Estonia, Finland,<br />
Norway, Poland, Russia and Sweden.<br />
Region Central Europe comprises the Group’s activities for external clients and debtors in Austria, the Czech Republic,<br />
Germany, Hungary, Slovakia and Switzerland.<br />
Region Western Europe comprises the Group’s activities for external clients and debtors in Belgium, France, Ireland, Italy,<br />
the Netherlands, Portugal, Spain and the United Kingdom.