Download - Intrum Justitia
Download - Intrum Justitia
Download - Intrum Justitia

Create successful ePaper yourself
Turn your PDF publications into a flip-book with our unique Google optimized e-Paper software.
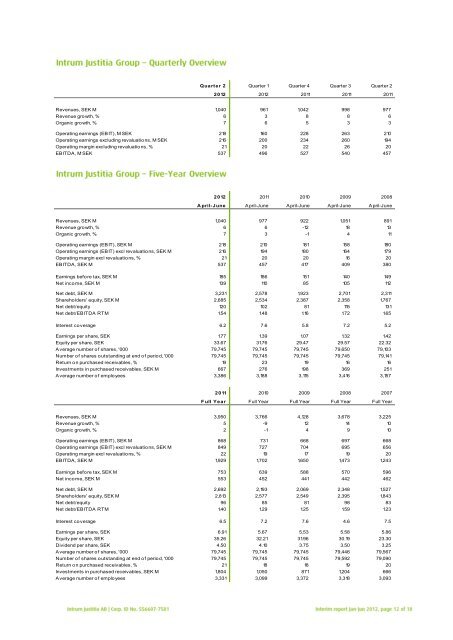
Quarter 2 Quarter 1 Quarter 4 Quarter 3 Quarter 2<br />
2012 2012 2011 2011 2011<br />
Revenues, SEK M 1,040 961 1,042 998 977<br />
Revenue growth, % 6 3 8 8 6<br />
Organic growth, % 7 6 5 3 3<br />
Operating earnings (EBIT), M SEK 218 160 228 263 210<br />
Operating earnings excluding revaluations, M SEK 216 200 234 260 194<br />
Operating margin excluding revaluations, % 21 20 22 26 20<br />
EBITDA, M SEK 537 496 527 540 457<br />
2012 2011 2010 2009 2008<br />
A pril-June April-June April-June April-June April-June<br />
Revenues, SEK M 1,040 977 922 1,051 891<br />
Revenue growth, % 6 6 -12 18 13<br />
Organic growth, % 7 3 -1 4 11<br />
Operating earnings (EBIT), SEK M 218 210 181 158 180<br />
Operating earnings (EBIT) excl revaluations, SEK M 216 194 180 164 179<br />
Operating margin excl revaluations, % 21 20 20 16 20<br />
EBITDA, SEK M 537 457 417 409 380<br />
Earnings before tax, SEK M 185 186 151 140 149<br />
Net income, SEK M 139 110 85 105 112<br />
Net debt, SEK M 3,231 2,578 1,923 2,701 2,311<br />
Shareholders' equity, SEK M 2,685 2,534 2,387 2,358 1,767<br />
Net debt/equity 120 102 81 115 131<br />
Net debt/EBITDA RTM 1.54 1.48 1.16 1.72 1.65<br />
Interest coverage 6.2 7.6 5.8 7.2 5.2<br />
Earnings per share, SEK 1.77 1.39 1.07 1.32 1.42<br />
Equity per share, SEK 33.67 31.76 29.47 29.57 22.32<br />
Average number of shares, '000 79,745 79,745 79,745 79,650 79,103<br />
Number of shares outstanding at end of period, '000 79,745 79,745 79,745 79,745 79,141<br />
Return on purchased receivables, % 19 23 19 16 16<br />
Investments in purchased receivables, SEK M 667 276 198 369 251<br />
Average number of employees 3,386 3,188 3,115 3,416 3,157<br />
2011 2010 2009 2008 2007<br />
F ull Year Full Year Full Year Full Year Full Year<br />
Revenues, SEK M 3,950 3,766 4,128 3,678 3,225<br />
Revenue growth, % 5 -9 12 14 10<br />
Organic growth, % 2 -1 4 9 10<br />
Operating earnings (EBIT), SEK M 868 731 668 697 668<br />
Operating earnings (EBIT) excl revaluations, SEK M 849 727 704 695 656<br />
Operating margin excl revaluations, % 22 19 17 19 20<br />
EBITDA, SEK M 1,929 1,702 1,650 1,473 1,243<br />
Earnings before tax, SEK M 753 639 588 570 596<br />
Net income, SEK M 553 452 441 442 462<br />
Net debt, SEK M 2,692 2,193 2,069 2,348 1,527<br />
Shareholders' equity, SEK M 2,813 2,577 2,549 2,395 1,843<br />
Net debt/equity 96 85 81 98 83<br />
Net debt/EBITDA RTM 1.40 1.29 1.25 1.59 1.23<br />
Interest coverage 6.5 7.2 7.6 4.6 7.5<br />
Earnings per share, SEK 6.91 5.67 5.53 5.58 5.86<br />
Equity per share, SEK 35.26 32.21 31.96 30.19 23.30<br />
Dividend per share, SEK 4.50 4.10 3.75 3.50 3.25<br />
Average number of shares, '000 79,745 79,745 79,745 79,446 79,567<br />
Number of shares outstanding at end of period, '000 79,745 79,745 79,745 79,592 79,090<br />
Return on purchased receivables, % 21 18 18 19 20<br />
Investments in purchased receivables, SEK M 1,804 1,050 871 1,204 666<br />
Average number of employees 3,331 3,099 3,372 3,318 3,093