Download - Intrum Justitia
Download - Intrum Justitia
Download - Intrum Justitia

You also want an ePaper? Increase the reach of your titles
YUMPU automatically turns print PDFs into web optimized ePapers that Google loves.
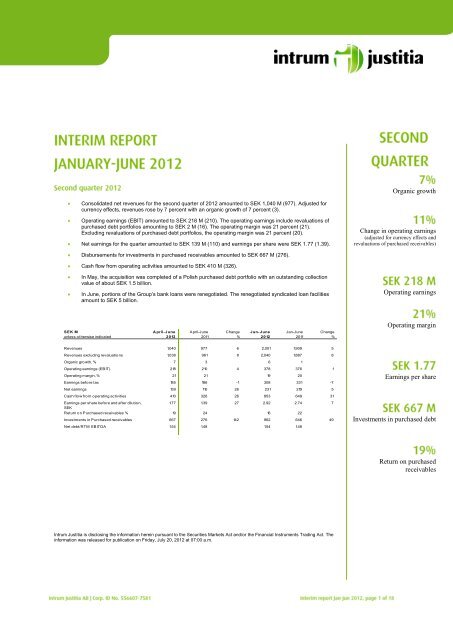
Consolidated net revenues for the second quarter of 2012 amounted to SEK 1,040 M (977). Adjusted for<br />
currency effects, revenues rose by 7 percent with an organic growth of 7 percent (3).<br />
Operating earnings (EBIT) amounted to SEK 218 M (210). The operating earnings include revaluations of<br />
purchased debt portfolios amounting to SEK 2 M (16). The operating margin was 21 percent (21).<br />
Excluding revaluations of purchased debt portfolios, the operating margin was 21 percent (20).<br />
Net earnings for the quarter amounted to SEK 139 M (110) and earnings per share were SEK 1.77 (1.39).<br />
Disbursements for investments in purchased receivables amounted to SEK 667 M (276).<br />
Cash flow from operating activities amounted to SEK 410 M (326).<br />
In May, the acquisition was completed of a Polish purchased debt portfolio with an outstanding collection<br />
value of about SEK 1.5 billion.<br />
In June, portions of the Group’s bank loans were renegotiated. The renegotiated syndicated loan facilities<br />
amount to SEK 5 billion.<br />
SEK M A pril-June April-June Change Jan-June Jan-June Change<br />
unless otherwise indicated 2012 2011 % 2012 2011 %<br />
Revenues 1,040 977 6 2,001 1,909 5<br />
Revenues excluding revaluations 1,038 961 8 2,040 1,887 8<br />
Organic growth, % 7 3 6 1<br />
Operating earnings (EBIT) 218 210 4 378 376 1<br />
Operating margin, % 21 21 19 20<br />
Earnings before tax 185 186 -1 308 331 -7<br />
Net earnings 139 110 26 231 219 5<br />
Cash flow from operating activities 410 326 26 853 649 31<br />
Earnings per share before and after dilution,<br />
SEK<br />
1.77 1.39 27 2.92 2.74 7<br />
Return on Purchased receivables % 19 24 16 22<br />
Investments in Purchased receivables 667 276 142 962 646 49<br />
Net debt/RTM EBITDA 1.54 1.48 1.54 1.48<br />
<strong>Intrum</strong> <strong>Justitia</strong> is disclosing the information herein pursuant to the Securities Markets Act and/or the Financial Instruments Trading Act. The<br />
information was released for publication on Friday, July 20, 2012 at 07:00 a.m.<br />
Organic growth<br />
Change in operating earnings<br />
(adjusted for currency effects and<br />
revaluations of purchased receivables)<br />
Operating earnings<br />
Operating margin<br />
Earnings per share<br />
Investments in purchased debt<br />
Return on purchased<br />
receivables
The second quarter of the year brought continued positive development for <strong>Intrum</strong> <strong>Justitia</strong><br />
compared with the year-earlier period. Organic growth was 7 percent and operating earnings<br />
rose by 11 percent adjusted for currency effects and portfolio revaluations.<br />
Cash flow from operations rose by 26 percent to SEK 410 M in the second quarter and the<br />
Group’s financial position is strong. During the quarter, to be able to benefit from<br />
opportunities for expansion over the coming years, we have continued our efforts to<br />
strengthen our loan financing by extending our opportunities to borrow from banks and to<br />
improve the maturity structure of the loans.<br />
Our Financial Services service line, which focuses primarily on purchased receivables,<br />
continues to develop well. Income rose by 12 percent in the second quarter, with continued<br />
high margins and a very favorable return. The investment level in the second quarter was the<br />
highest in <strong>Intrum</strong> <strong>Justitia</strong>’s history and was mainly attributable to a high level of investment<br />
in Northern Europe.<br />
In our Credit Management service line, we are seeing a continued stable trend with a<br />
5 percent growth in revenues in the second quarter. Growth is being driven by increasing<br />
investment in purchased debt portfolios and by growth in credit management on assignment<br />
from external customers. In the short term, operating earnings will be affected negatively by<br />
continued increases in expenses for pursuing cases through the legal systems – a trend that<br />
will continue in the second half of the year. In the long term, this generates favorable<br />
conditions for strengthening profitability and increasing the stability in the return on our<br />
portfolios of purchased receivables.<br />
In our regions, Northern Europe has continued to show a positive trend in both revenues and<br />
operating earnings as a consequence of increased investments in portfolios of purchased<br />
receivables, as well as good organic growth in Credit Management. In Central Europe,<br />
earnings and margins developed favorably in the second quarter, although the level of<br />
investment in portfolios with purchased receivables was unsatisfactory. In Western Europe,<br />
we are seeing good organic growth in Credit Management but a negative impact on revenue<br />
and earnings from selectively decreased investment levels in purchased receivables as a<br />
consequence of the uncertain macro trend in several countries in the region.<br />
Work to develop our service offering in the early stages of the payment chain is continuing<br />
according to plan and towards the end of the second quarter, we launched a factoring service<br />
in the Swedish market.
SEK M A pril-June April-June Change Jan-June Jan-June Change F ull year<br />
unless otherwise indicated 2012 2011 % 2012 2011 % 2011<br />
Revenues 1,040 977 6 2,001 1,909 5 3,950<br />
Operating earnings (EBIT) 218 210 4 378 376 1 868<br />
Operating margin, % 21 21 19 20 22<br />
Net financial items -33 -24 38 -70 -45 56 -115<br />
Tax -46 -76 -39 -77 -112 -31 -200<br />
Net income 139 110 26 231 219 5 553<br />
Average number of employees 3,386 3,188 6 3,381 3,181 6 3,331<br />
The increase in revenues by 6 percent in the second quarter consists of organic growth of 7 percent,<br />
acquisition effects of 1 percent, revaluation of purchased debt of a negative 1 percent and a currency<br />
effect of 1 percent. The improved organic growth is primarily attributable to the increased investment<br />
volume in purchased receivables, but also by organic growth in credit management on assignment<br />
from external customers. Operating earnings improved by 4 percent in the second quarter, although,<br />
adjusted for currency effects and revaluations of portfolios of purchased receivables, the increase was<br />
11 percent. The improved operating earnings and operating margin are mainly attributable to a change<br />
in the mix of services, good cost control and improved internal efficiency. A more detailed<br />
description of the development of operations in the Group’s regions and service lines is provided<br />
below.<br />
Net financial items for the quarter amounted to an expense of SEK 33 (24). The increase is mainly<br />
explained by increased loan volumes. In addition, exchange rate differences have affected net<br />
financial items by SEK 0 M (neg 2), and other financial items had a negative effect of SEK 7 M<br />
(neg 3).<br />
Earnings for the quarter were charged with tax of 25 percent, corresponding to the estimated average<br />
tax cost for the 2012 full year. Taxes for the second quarter 2011 included a one-off cost of SEK 29<br />
M attributable to a dispute in Finland. Further information on ongoing tax disputes is provided in the<br />
section “Taxation assessments”.<br />
Cash flow from operating activities over the quarter amounted to SEK 410 M (326). The increase<br />
compared with the preceding year is primarily attributable to improved operating earnings, excluding<br />
depreciation and amortization. Disbursements during the quarter for investments in purchased<br />
receivables amounted to SEK 667 M (276).<br />
SEK M A pril-June April-June Change<br />
unless otherwise indicated 2012 2011 %<br />
Net Debt 3,231 2,578 25<br />
Net debt/RTM EBITDA 1.54 1.48<br />
Shareholders' equity 2,685 2,534 6<br />
Liquid assets 419 356 18
The increase in consolidated net debt is compared with the year-earlier period is primarily attributable<br />
to a high level of investment in purchased receivables. Thanks to a favorable earnings trend and<br />
strong cash flow, consolidated net debt in relation to operating earnings before depreciation and<br />
amortization was at a relatively unchanged and low level of 1.54.<br />
In June, portions of the Group’s bank loans were renegotiated with the purpose of improving the<br />
structure of the Group’s long-term financing. The renegotiated syndicated loan facilities amount to<br />
SEK 5 billion, of which approximately SEK 2 billion has been utilized at the end of the quarter. The<br />
new bank financing entails a more flexible maturity structure whereby the loan, including a bond loan<br />
of SEK 1 billion, matures in an amount of SEK 2 billion per year over the period 2015-2017. For its<br />
short-term financing, the Group uses a commercial paper program involving borrowing of SEK<br />
615 M as per June 30, 2012.<br />
Consolidated goodwill amounted to SEK 2,405 M compared with SEK 2,204 M as per December 31,<br />
2011. The change was attributable to the acquisition in the first quarter for SEK 224 M and net<br />
negative exchange rate differences of SEK 23 M.<br />
SEK M A pril-June April-June Change Jan-June Jan-June Change F ull Year<br />
2012 2011 % 2012 2011 % 2011<br />
Revenues 487 440 11 942 848 11 1,777<br />
Operating earnings 120 117 3 233 202 15 453<br />
Revenues excluding revaluations 486 428 14 939 834 13 1,759<br />
Operating earnings excluding revaluations 119 105 13 230 188 22 435<br />
Operating margin excluding revaluations, % 24 25 24 23 25<br />
Revenues for the quarter rose by 15 percent and operating earnings improved by 13 percent adjusted<br />
for currency effects and revaluations, compared with the year-earlier period. The strong growth in<br />
revenues in the region is driven by continued high investment levels in purchased receivables and a<br />
favorable trend in the Credit Management operations. Operating earnings are developing well through<br />
organic improvements, as well as positive effects from acquired operations in previous years, where<br />
the operating earnings for the second quarter of 2011 were burdened by integration costs of SEK 5 M.<br />
Costs for legal collection measures in the region continue to rise compared with last year, which has<br />
had a short-term negative impact on earnings.<br />
SEK M A pril-June April-June Change Jan-June Jan-June Change F ull Year<br />
2012 2011 % 2012 2011 % 2011<br />
Revenues 222 211 5 462 422 9 906<br />
Operating earnings 41 32 28 89 73 22 200<br />
Revenues excluding revaluations 221 208 6 462 414 12 899<br />
Operating earnings excluding revaluations 40 29 38 89 65 37 193<br />
Operating margin excluding revaluations, % 18 14 19 16 21<br />
Revenues for the quarter rose by 6 percent and operating earnings improved by 32 percent, adjusted<br />
for currency effects and revaluations, compared with the year-earlier period. High levels of<br />
investment in purchased receivables in 2011 and a stable trend in Credit Management have<br />
contributed to the improved earnings. To compensate for decreased volumes in aging portfolios and<br />
to strengthen the market position, mainly in Germany, the region continues to focus on increasing<br />
volumes in purchased receivables.
SEK M A pril-June April-June Change Jan-June Jan-June Change F ull Year<br />
2012 2011 % 2012 2011 % 2011<br />
Revenues 331 326 2 597 639 -7 1,267<br />
Operating earnings 57 62 -8 56 111 -50 224<br />
Revenues excluding revaluations 331 325 2 639 639 0 1,273<br />
Operating earnings excluding revaluations 57 61 -7 98 111 -12 230<br />
Operating margin excluding revaluations, % 17 19 15 17 18<br />
Revenues for the quarter rose by 3 percent and operating earnings decreased by 4 percent, adjusted<br />
for currency effects and revaluations, compared with the year-earlier period. The positive income<br />
trend is among others due to good volume development in Credit Management and the acquired unit<br />
in the Netherlands. The uncertain macroeconomic situation affects both revenues and operating<br />
earnings negatively as the uncertainty has had the consequence of the region having selectively<br />
reduced its investments in purchased receivables. Furthermore, operating earnings were negatively<br />
impacted by increasing costs of collection, something that <strong>Intrum</strong> <strong>Justitia</strong> is unable to compensate for<br />
in terms of volumes in the current market. Operating earnings were positively impacted by a nonrecurring<br />
effect of around SEK 7 M during the second quarter.<br />
SEK M A pril-June April-June Change Jan-June Jan-June Change F ull Year<br />
2012 2011 % 2012 2011 % 2011<br />
Revenues 854 812 5 1,691 1,598 6 3,293<br />
Service line earnings 197 196 1 395 388 2 843<br />
Service line margin, % 23 24 23 24 26<br />
Adjusted for currency effects, revenues rose by 6 percent in the quarter, while operating earnings<br />
were unchanged compared with the preceding year. The positive trend from both the fourth quarter of<br />
2011 and the first quarter of 2012 in terms of organic growth has also continued in the second quarter.<br />
Operating earnings were affected negatively by increased costs for collection measures.<br />
SEK M A pril-June April-June Change Jan-June Jan-June Change F ull Year<br />
2012 2011 % 2012 2011 % 2011<br />
Revenues 312 279 12 553 517 7 1,088<br />
Service line earnings 166 156 6 272 282 -4 591<br />
Service line margin, % 53 56 49 55 54<br />
Return on Purchased receivables, % 19 24 16 22 21<br />
Investments in Purchased receivables 667 276 142 962 646 49 1,804<br />
Carrying amount, Purchased Receivables 3,625 2,646 37 3,625 2,646 37 3,229<br />
Activity in the procurement of portfolios of purchased receivables is good and investments for the<br />
quarter were the highest in <strong>Intrum</strong> <strong>Justitia</strong>’s history as a consequence of an acquisition of a large<br />
Polish bank portfolio and favorable activity in the procurement of small and medium-sized portfolios.<br />
The acquisition of the Polish bank portfolio was completed in June, meaning that the transaction will<br />
have an effect of operating earnings as of the third quarter. The portfolio has an outstanding value of<br />
about SEK 1.5 billion. The return of the portfolio is negatively impacted by the fact that the Polish<br />
banking portfolio has been included in the reported value, but without having had any effect on the<br />
operating result.<br />
For a description of <strong>Intrum</strong> <strong>Justitia</strong>’s accounting principle for purchased receivables, please see page<br />
56-57 of the Annual Report 2011.
Europe is characterized by considerable regional differences and there is substantial uncertainty<br />
regarding the macroeconomic situation in several countries. In a substantially weakened<br />
macroeconomic situation in Europe, with increased unemployment, <strong>Intrum</strong> <strong>Justitia</strong> is negatively<br />
affected.<br />
In <strong>Intrum</strong> <strong>Justitia</strong>’s view, the Group’s strategic focus is well attuned to the market trend, with a<br />
broadening of credit management services and a link to risk reduction and financial services based on<br />
strong, market-leading collection operations. Companies’ need to generate stronger and more<br />
predictable cash flow is increasing, as is the need to create additional alternatives for the financing of<br />
working capital, for example by selling receivables. These are trends that, in the long term, will<br />
benefit <strong>Intrum</strong> <strong>Justitia</strong>.<br />
Following a tax audit of the Group’s Swedish parent company for the 2009 financial year, the<br />
Swedish National Tax Board decided to impose a tax surcharge of SEK 19 M in 2011. <strong>Intrum</strong> <strong>Justitia</strong><br />
takes the view, however, that its tax returns contained no misstatements and that the conditions for a<br />
tax surcharge have therefore not been met. Consequently, the company has appealed the ruling with<br />
regard to the tax surcharge and has not made any provision for this cost.<br />
In connection with a tax audit in Belgium in 2011, the company’s right to make so-called notional<br />
interest deductions was brought into question. The company is discussing the matter with the tax<br />
authorities but risks, in the worst-case scenario, being liable to pay additional tax for 2008 and 2009<br />
as well as a tax surcharge and interest totaling EUR 10 M. In the opinion of the company, the tax<br />
authorities’ assessment is incorrect since it refers to legal cases regarding situations different from<br />
that at hand. Consequently, <strong>Intrum</strong> <strong>Justitia</strong> has not made any provisions for additional taxes.<br />
In the second quarter of 2012, <strong>Intrum</strong> <strong>Justitia</strong> has not had cause to change its view of the most likely<br />
outcome of the ongoing tax disputes and has not therefore made any provisions for additional tax<br />
expenses in the closing account for the quarter.<br />
The Group’s publicly listed Parent Company, <strong>Intrum</strong> <strong>Justitia</strong> AB (publ), owns the subsidiaries,<br />
provides the Group’s head office functions and handles certain Group-wide development work,<br />
services and marketing.<br />
The Parent Company reported net revenues of SEK 36 M (35) for the six-month period and earnings<br />
before tax of SEK -78 M (-47). During the period the Parent Company invested SEK 0 M (0) in fixed<br />
assets and had liquid assets of SEK 187 M (65) at the end of the period. The average number of<br />
employees was 39 (30).<br />
This interim report has been prepared in accordance with the Annual Accounts Act and IAS 34<br />
Interim Financial Reporting for the Group and in accordance with Chapter 9 of the Annual Accounts<br />
Act for the Parent Company. The same accounting principles and calculation methods have been<br />
applied as in the most recent Annual Report.<br />
The Group’s and the Parent Company’s risks include strategic risks related to economic<br />
developments and acquisitions as well as operational risks related to, among other things, possible<br />
errors and omissions as well as operations in different countries. Moreover, there are risks related to<br />
the regulatory environment and financial risks such as market risk, financing risk, credit risk, risks
inherent in purchased receivables and guarantees in conjunction with the screening of charge card<br />
applications. The risks are described in more detail in the Board of Directors’ report in <strong>Intrum</strong><br />
<strong>Justitia</strong>’s 2011 Annual Report. No significant risks are considered to have arisen besides those<br />
described in the Annual Report.<br />
The interim report and presentation material are available at www.intrum.com > Investor relations.<br />
President & CEO Lars Wollung and Chief Financial Officer Erik Forsberg will comment on the<br />
report at a teleconference today, starting at 9:00 a.m. CET. The presentation can be followed at<br />
www.intrum.com and/or www.financialhearings.com. To participate by phone, call +46 (0)8 505 597<br />
72 (SE) or +44 (0)20 710 862 05 (UK).<br />
Lars Wollung, President & CEO <strong>Intrum</strong> <strong>Justitia</strong> AB (publ) Tel: +46 (0)8-546 10 202<br />
Erik Forsberg, Chief Financial Officer, tel.: +46 (0)8-546 10 202<br />
Annika Billberg, IR & Communications Director, tel.: +46 (0)8-545 10 203, mobile: +46 (0)70 267<br />
9791
The interim report for January-September will be published October 24, 2012<br />
The year-end report for 2012 will be published February 5, 2013<br />
This interim report has not been reviewed by the company’s auditors.<br />
The interim report and other financial information are available at <strong>Intrum</strong> <strong>Justitia</strong>’s website: www.intrum.com<br />
Denna delårsrapport finns även på svenska.<br />
The Board of Directors and the President provide their assurance that this interim report provides an accurate overview of the<br />
operations, position and earnings of the Group and the Parent Company, and that it also describes the principal risks and<br />
sources of uncertainty faced by the Parent Company and its subsidiaries.<br />
Stockholm, July 20, 2012<br />
Lars Lundquist Matts Ekman Helen Fasth-Gillstedt<br />
Chairman of the Board Board member Board member<br />
Joakim Rubin Charlotte Strömberg Fredrik Trägårdh Joakim Westh<br />
Board member Board member Board member Board member<br />
Lars Wollung<br />
President and CEO<br />
<strong>Intrum</strong> <strong>Justitia</strong> is Europe’s leading Credit Management Services (CMS) group, offering<br />
comprehensive credit management services, including Purchased Debt, designed to measurably<br />
improve clients’ cash flows and long-term profitability. Founded in 1923, <strong>Intrum</strong> <strong>Justitia</strong> has some<br />
3,300 employees in 20 markets. Consolidated revenues amounted to SEK 4 billion in 2011. <strong>Intrum</strong><br />
<strong>Justitia</strong> AB has been listed on the NASDAQ OMX Stockholm exchange since 2002. For further<br />
information, please visit www.intrum.com.
SEK M A pril-June April-June Jan-June Jan-June Full Year<br />
2012 2011 2012 2011 2011<br />
Revenues 1,040 977 2,001 1,909 3,950<br />
Cost of sales -635 -587 -1,259 -1,158 -2,363<br />
Gro ss earnings 405 390 742 751 1,587<br />
Sales and marketing expenses -61 -63 -119 -128 -243<br />
General and administrative expenses -127 -117 -245 -239 -470<br />
Disposal of shares in associated company 0 -1 0 -9 -9<br />
Participation in associated companies 1 1 0 1 3<br />
Operating earnings (EB IT ) 218 210 378 376 868<br />
Net financial items -33 -24 -70 -45 -115<br />
Earnings befo re tax 185 186 308 331 753<br />
Tax -46 -76 -77 -112 -200<br />
N et inco me fo r the perio d 139 110 231 219 553<br />
Of which attributable to :<br />
Parent company's shareholders 141 110 233 218 552<br />
Non-controlling interest -2 0 -2 1 1<br />
N et earnings fo r the perio d 139 110 231 219 553<br />
Earnings per share before and after dilution 1.77 1.39 2.92 2.74 6.91<br />
SEK M A pril-June April-June Jan-June Jan-June Jan-June<br />
2012 2011 2012 2011 2011<br />
Net income for the period 139 110 231 219 553<br />
Currency translation difference 1 46 0 66 11<br />
C o mprehensive inco me fo r the perio d 140 156 231 285 564<br />
Of which attributable to :<br />
Parent company's shareholders 142 156 233 284 562<br />
Non-controlling interest -2 0 -2 1 2<br />
C o mprehensive inco me fo r the perio d 140 156 231 285 564
SEK M 30 Jun 30 Jun 31 Dec<br />
ASSETS<br />
Intangible fixed assets<br />
Capitalized expenditure for IT development and other<br />
intangibles<br />
2012 2011 2011<br />
281 305 307<br />
Client relationships 112 139 102<br />
Goodwill 2,405 2,193 2,204<br />
T o tal intangible fixed assets 2,798 2,637 2,613<br />
T angible fixed assets 66 70 66<br />
Other fixed assets<br />
Shares and participations in associated companies and<br />
other companies<br />
11 12 12<br />
Purchased receivables 3,625 2,646 3,229<br />
Deferred tax assets 71 76 71<br />
Other long-term receivables 23 46 32<br />
T o tal o ther fixed assets 3,730 2,780 3,344<br />
T o tal fixed assets 6,594 5,487 6,023<br />
Current Assets<br />
Accounts receivable 269 274 266<br />
Client funds 461 583 580<br />
Tax assets 28 55 28<br />
Other receivables 287 303 266<br />
Prepaid expenses and accrued income 164 127 119<br />
Cash and cash equivalents 419 356 625<br />
T o tal current assets 1,628 1,698 1,884<br />
TOTAL ASSETS 8,222 7,185 7,907<br />
SHAREHOLDERS' EQUITY AND LIABILITIES<br />
Attributable to parent company's shareholders 2,685 2,533 2,811<br />
Attributable to non-controlling interest 0 1 2<br />
T o tal shareho lders' equity 2,685 2,534 2,813<br />
Long-term liabilities<br />
Liabilities to credit institutions 1,930 2,827 2,588<br />
M edium term note 987 - -<br />
Other long-term liabilities 229 65 61<br />
Provisions for pensions 47 39 46<br />
Other long-term provisions 3 12 3<br />
Deferred tax liabilities 95 74 89<br />
T o tal lo ng-term liabilities 3,291 3,017 2,787<br />
Current liabilities<br />
Liabilities to credit institutions 20 2 5<br />
Commercial paper 615 - 617<br />
Client funds payable 461 583 580<br />
Accounts payable 138 116 133<br />
Income tax liabilities 191 216 203<br />
Advances from clients 23 28 27<br />
Other current liabilities 267 206 229<br />
Accrued expenses and prepaid income 526 474 505<br />
Other short-term provisions 5 9 8<br />
T o tal current liabilities 2,246 1,634 2,307<br />
TOTAL SHAREHOLDERS' EQUITY AND<br />
LIABILITIES<br />
8,222 7,185 7,907
SEK M 2012 2011<br />
Attributable to<br />
Parent<br />
Company's<br />
shareholders<br />
Non-controlling<br />
interest T o tal<br />
Attributable to<br />
Parent<br />
Company's<br />
shareholders<br />
Non-controlling<br />
interest T o tal<br />
Opening B alance, January 1 2,811 2 2,813 2,576 0 2,576<br />
Dividend -359 -359 -327 -327<br />
Comprehensive income for the period 233 -2 231 284 1 285<br />
C lo sing B alance, June 30 2,685 0 2,685 2,533 1 2,534<br />
SEK M A pril-June April-June Jan-June Jan-June F ull Year<br />
2012 2011 2012 2011 2011<br />
Operating activities<br />
Operating earnings (EBIT) 218 210 378 376 868<br />
Depreciation/amortization 44 42 86 85 173<br />
Amortization/revaluation of purchased receivables 275 190 568 386 888<br />
Adjustment for expenses not included in cash flow -2 -2 0 5 9<br />
Interest received 2 4 10 9 22<br />
Interest paid and other financial expenses -30 -25 -65 -45 -99<br />
Income tax paid -40 -65 -89 -129 -177<br />
C ash flo w fro m o perating activities befo re<br />
changes in wo rking capital<br />
467 354 888 687 1,684<br />
Changes in working capital -57 -28 -35 -38 84<br />
C ash flo w fro m o perating activities 410 326 853 649 1,768<br />
Investing activities<br />
Purchases of tangible and intangible fixed assets -37 -27 -64 -48 -120<br />
Debt purchases -667 -276 -962 -646 -1,804<br />
Purchases of shares in subsidiaries and other companies 0 -1 -69 -1 -43<br />
Disposals of shares in subsidiaries and associated<br />
companies<br />
0 0 0 3 3<br />
Other cash flow from investing activities 5 5 10 9 18<br />
C ash flo w fro m investing activities -699 -299 -1,085 -683 -1,946<br />
Financing activities<br />
Borrowings and repayment of loans 361 341 381 199 624<br />
Share dividend to Parent Company's shareholders -359 -327 -359 -327 -327<br />
C ash flo w fro m financing activities 2 14 22 -128 297<br />
C hange in liquid assets -287 41 -210 -162 119<br />
Opening balance o f liquid assets 706 295 625 507 507<br />
Exchange rate differences in liquid assets 0 20 4 11 -1<br />
C lo sing balance o f liquid assets 419 356 419 356 625
Quarter 2 Quarter 1 Quarter 4 Quarter 3 Quarter 2<br />
2012 2012 2011 2011 2011<br />
Revenues, SEK M 1,040 961 1,042 998 977<br />
Revenue growth, % 6 3 8 8 6<br />
Organic growth, % 7 6 5 3 3<br />
Operating earnings (EBIT), M SEK 218 160 228 263 210<br />
Operating earnings excluding revaluations, M SEK 216 200 234 260 194<br />
Operating margin excluding revaluations, % 21 20 22 26 20<br />
EBITDA, M SEK 537 496 527 540 457<br />
2012 2011 2010 2009 2008<br />
A pril-June April-June April-June April-June April-June<br />
Revenues, SEK M 1,040 977 922 1,051 891<br />
Revenue growth, % 6 6 -12 18 13<br />
Organic growth, % 7 3 -1 4 11<br />
Operating earnings (EBIT), SEK M 218 210 181 158 180<br />
Operating earnings (EBIT) excl revaluations, SEK M 216 194 180 164 179<br />
Operating margin excl revaluations, % 21 20 20 16 20<br />
EBITDA, SEK M 537 457 417 409 380<br />
Earnings before tax, SEK M 185 186 151 140 149<br />
Net income, SEK M 139 110 85 105 112<br />
Net debt, SEK M 3,231 2,578 1,923 2,701 2,311<br />
Shareholders' equity, SEK M 2,685 2,534 2,387 2,358 1,767<br />
Net debt/equity 120 102 81 115 131<br />
Net debt/EBITDA RTM 1.54 1.48 1.16 1.72 1.65<br />
Interest coverage 6.2 7.6 5.8 7.2 5.2<br />
Earnings per share, SEK 1.77 1.39 1.07 1.32 1.42<br />
Equity per share, SEK 33.67 31.76 29.47 29.57 22.32<br />
Average number of shares, '000 79,745 79,745 79,745 79,650 79,103<br />
Number of shares outstanding at end of period, '000 79,745 79,745 79,745 79,745 79,141<br />
Return on purchased receivables, % 19 23 19 16 16<br />
Investments in purchased receivables, SEK M 667 276 198 369 251<br />
Average number of employees 3,386 3,188 3,115 3,416 3,157<br />
2011 2010 2009 2008 2007<br />
F ull Year Full Year Full Year Full Year Full Year<br />
Revenues, SEK M 3,950 3,766 4,128 3,678 3,225<br />
Revenue growth, % 5 -9 12 14 10<br />
Organic growth, % 2 -1 4 9 10<br />
Operating earnings (EBIT), SEK M 868 731 668 697 668<br />
Operating earnings (EBIT) excl revaluations, SEK M 849 727 704 695 656<br />
Operating margin excl revaluations, % 22 19 17 19 20<br />
EBITDA, SEK M 1,929 1,702 1,650 1,473 1,243<br />
Earnings before tax, SEK M 753 639 588 570 596<br />
Net income, SEK M 553 452 441 442 462<br />
Net debt, SEK M 2,692 2,193 2,069 2,348 1,527<br />
Shareholders' equity, SEK M 2,813 2,577 2,549 2,395 1,843<br />
Net debt/equity 96 85 81 98 83<br />
Net debt/EBITDA RTM 1.40 1.29 1.25 1.59 1.23<br />
Interest coverage 6.5 7.2 7.6 4.6 7.5<br />
Earnings per share, SEK 6.91 5.67 5.53 5.58 5.86<br />
Equity per share, SEK 35.26 32.21 31.96 30.19 23.30<br />
Dividend per share, SEK 4.50 4.10 3.75 3.50 3.25<br />
Average number of shares, '000 79,745 79,745 79,745 79,446 79,567<br />
Number of shares outstanding at end of period, '000 79,745 79,745 79,745 79,592 79,090<br />
Return on purchased receivables, % 21 18 18 19 20<br />
Investments in purchased receivables, SEK M 1,804 1,050 871 1,204 666<br />
Average number of employees 3,331 3,099 3,372 3,318 3,093
SEK M A pril-June April-June Change Jan-June Jan-June Change F ull Year<br />
2012 2011 % 2012 2011 % 2011<br />
Northern Europe 487 440 11 942 848 11 1,777<br />
Central Europe 222 211 5 462 422 9 906<br />
Western Europe 331 326 2 597 639 -7 1,267<br />
T o tal revenues fro m external clients 1,040 977 6 2,001 1,909 5 3,950<br />
SEK M A pril-June April-June Change Jan-June Jan-June Change F ull Year<br />
2012 2011 % 2012 2011 % 2011<br />
Northern Europe 37 30 23 72 54 33 116<br />
Central Europe 48 42 14 100 82 22 192<br />
Western Europe 22 23 -4 42 47 -11 92<br />
Eliminations -107 -95 13 -214 -183 17 -400<br />
T o tal interco mpany revenues 0 0 0 0 0<br />
SEK M A pril-June April-June Jan-June Jan-June F ull Year<br />
2012 2011 2012 2011 2011<br />
Northern Europe 1 12 3 14 18<br />
Central Europe 1 3 0 8 7<br />
Western Europe 0 1 -42 0 -6<br />
T o tal revaluatio n 2 16 -39 22 19<br />
SEK M A pril-June April-June Change Jan-June Jan-June Change F ull Year<br />
2012 2011 % 2012 2011 % 2011<br />
Northern Europe 486 428 14 939 834 13 1,759<br />
Central Europe 221 208 6 462 414 12 899<br />
Western Europe 331 325 2 639 639 0 1,273<br />
T o tal revenues excluding revaluatio ns 1,038 961 8 2,040 1,887 8 3,931
SEK M A pril-June April-June Jan-June Jan-June F ull Year<br />
2012 2011 2012 2011 2011<br />
Northern Europe -1 -1 -2 -2 -4<br />
Central Europe 0 0 0 0 0<br />
Western Europe -4 -3 -7 -6 -13<br />
T o tal amo rtizatio n and impairment -5 -4 -9 -8 -17<br />
SEK M A pril-June April-June Change Jan-June Jan-June Change F ull Year<br />
2012 2011 % 2012 2011 % 2011<br />
Northern Europe 120 117 3 233 202 15 453<br />
Central Europe 41 32 28 89 73 22 200<br />
Western Europe 57 62 -8 56 111 -50 224<br />
Loss on disposal of shares in associated<br />
company<br />
- -1 - - -9 - -8<br />
Participation in Iceland - 0 - - -1 - -1<br />
T o tal o perating earnings (EB IT ) 218 210 4 378 376 1 868<br />
Net financial items -33 -24 38 -70 -45 56 -115<br />
Earnings befo re tax 185 186 -1 308 331 -7 753<br />
SEK M A pril-June April-June Change Jan-June Jan-June Change F ull Year<br />
2012 2011 % 2012 2011 % 2011<br />
Northern Europe 119 105 13 230 188 22 435<br />
Central Europe 40 29 38 89 65 37 193<br />
Western Europe 57 61 -7 98 111 -12 230<br />
Loss on disposal of shares in asscciated<br />
company<br />
- -1 - - -9 - -8<br />
Participation in Iceland - 0 - - -1 - -1<br />
T o tal o perating earnings excluding<br />
revaluatio ns<br />
216 194 11 417 354 18 849<br />
% A pril-June April-June Jan-June Jan-June F ull Year<br />
2012 2011 2012 2011 2011<br />
Northern Europe 24 25 24 23 25<br />
Central Europe 18 14 19 16 21<br />
Western Europe 17 19 15 17 18<br />
Operating margin fo r the Gro up 21 20 20 19 22
SEK M A pril-June April-June Change Jan-June Jan-June Change F ull Year<br />
2012 2011 % 2012 2011 % 2011<br />
Credit M anagement 854 812 5 1,691 1,598 6 3,293<br />
Financial services 312 279 12 553 517 7 1,088<br />
Elimination of inter-service line revenue -126 -114 11 -243 -206 18 -431<br />
T o tal revenues 1,040 977 6 2,001 1,909 5 3,950<br />
SEK M A pril-June April-June Change Jan-June Jan-June Change F ull Year<br />
2012 2011 % 2012 2011 % 2011<br />
External Credit M anagement revenues 728 698 4 1,448 1,392 4 2,862<br />
Collections on purchased receivables 574 472 22 1,098 897 22 1,930<br />
Amortization of purchased receivables -277 -219 26 -530 -421 26 -907<br />
Revaluation of purchased receivables 2 16 - -39 22 - 19<br />
Other revenues from financial services 13 10 30 24 19 26 46<br />
T o tal revenues 1,040 977 6 2,001 1,909 5 3,950<br />
SEK M A pril-June April-June Change Jan-June Jan-June Change F ull Year<br />
2012 2011 % 2012 2011 % 2011<br />
Credit M anagement 197 196 1 395 388 2 843<br />
Financial services 166 156 6 272 282 -4 591<br />
Common costs -145 -141 3 -289 -294 -2 -566<br />
T o tal o perating earnings 218 211 3 378 376 1 868<br />
% A pril-June April-June Jan-June Jan-June F ull Year<br />
2012 2011 2012 2011 2011<br />
Credit M anagement 23 24 23 24 26<br />
Financial services 53 56 49 55 54<br />
Operating margin fo r the Gro up 21 21 19 20 22
SEK M Jan-June Jan-June Full Year<br />
2012 2011 2011<br />
Revenues 36 35 75<br />
Gro ss earnings 36 35 75<br />
Sales and marketing expenses -8 -7 -15<br />
General and administrative expenses -68 -70 -140<br />
Operating earnings (EB IT ) -40 -42 -80<br />
Income from subsidiaries 0 0 97<br />
Net financial items -38 -5 -35<br />
Earnings befo re tax -78 -47 -18<br />
Tax 0 0 0<br />
N et earnings fo r the perio d -78 -47 -18<br />
SEK M Jan-June Jan-June Full Year<br />
2012 2011 2011<br />
Net earnings for the period -78 -47 -18<br />
Other comprehensive income: Change of translation<br />
reserve<br />
59 -29 21<br />
T o tal co mprehensive inco me -19 -76 3<br />
SEK M 30 Jun 30 Jun 31 Dec<br />
A SSET S<br />
F ixed assets<br />
2012 2011 2011<br />
Intangible fixed assets 1 1 1<br />
Tangible fixed assets 1 1 1<br />
Financial fixed assets 7,501 7,161 7,717<br />
T o tal fixed assets 7,503 7,163 7,719<br />
C urrent assets<br />
Current receivables 2,389 2,331 2,473<br />
Cash and bank balances 187 65 272<br />
T o tal current assets 2,576 2,396 2,745<br />
T OT A L A SSET S 10,079 9,559 10,464<br />
SH A R EH OLD ER S' EQUIT Y A N D<br />
LIA B ILIT IES<br />
Restricted equity 284 284 284<br />
Unrestricted equity 4,198 4,499 4,577<br />
T o tal shareho lders' equity 4,482 4,783 4,861<br />
Provisions 0 5 0<br />
Long-term liabilities 3,891 3,690 3,807<br />
Current liabilities 1,706 1,081 1,796<br />
T OT A L SH A R EH OLD ER S* EQUIT Y A N D<br />
LIA B ILIT IES<br />
10,079 9,559 10,464<br />
Pledged assets None None None<br />
Contingent liabilities 87 None 90
120<br />
110<br />
100<br />
90<br />
80<br />
70<br />
60<br />
50<br />
30 June 2012<br />
<strong>Intrum</strong> <strong>Justitia</strong> OMXS<br />
N o o f<br />
shares C apital and<br />
Vo tes, %<br />
Fidelity Investment M anagement 7,981,067 10.0<br />
Lannebo Funds 4,482,536 5.6<br />
Carnegie Funds 4,063,000 5.1<br />
CapM an Oyj 3,607,550 4.5<br />
Government of Norway 2,712,359 3.4<br />
State of New Jersey Pension Fund 2,500,000 3.1<br />
SEB Funds 2,352,565 3.0<br />
First Swedish National Pension Fund 2,316,939 2.9<br />
Swedbank Robur Funds 2,276,737 2.9<br />
Fourth Swedish National Pension Fund 2,248,891 2.8<br />
SHB Funds 1,593,766 2.0<br />
Horn Fjarfestingarfelag ehf 1,529,784 1.9<br />
Confederation of Swedish Enterprise 1,500,000 1.9<br />
Invesco Funds 1,341,517 1.7<br />
Odin Funds 1,175,966 1.5<br />
T o tal, fifteen largest shareho lders 41,682,677 52.3<br />
T o tal number o f shares: 79,744,651<br />
Swedish ownership accounted for 45.3 percent (institutions 16.6 percentage points,<br />
mutual funds 22.4 percentage points, retail 6.3 percentage points) Source: SIS Aktieägarservice
Definitions<br />
Increases in revenues, operating earnings and earnings before tax refer to the percentage increase in each income statement<br />
item year-over-year.<br />
Organic growth refers to the average increase in revenues in local currency, adjusted for revaluations of portfolios of<br />
purchased receivables and the effects of acquisitions and divestments of Group companies.<br />
Consolidated revenues include variable collection commissions, fixed collection fees, debtor fees, guarantee commissions,<br />
subscription revenue and income from purchased receivables operations. Income from purchased receivables consists of<br />
collected amounts less amortization, i.e., the decrease in the portfolios’ book value for the period.<br />
Operating margin is operating earnings as a percentage of revenues.<br />
Return on purchased receivables is the service line earnings for the period, recalculated on a full-year basis, as a percentage<br />
of the average carrying amount of the balance-sheet item purchased receivables.<br />
Net debt is interest-bearing liabilities and pension provisions less liquid assets and interest-bearing receivables.<br />
Earnings before interest, taxes, depreciation and amortization are operating earnings where depreciation on fixed assets as<br />
well as amortization and revaluations of purchased receivables are added back. The figure is presented on a rolling twelve<br />
month basis, abbreviated RTM.<br />
Interest coverage ratio is earnings after financial items plus financial expenses divided by financial expenses.<br />
Service line earnings are that part of operating earnings that can be attributed to the service lines, i.e. excluding common<br />
costs for marketing and administration.<br />
Region Northern Europe comprises the Group’s activities for external clients and debtors in Denmark, Estonia, Finland,<br />
Norway, Poland, Russia and Sweden.<br />
Region Central Europe comprises the Group’s activities for external clients and debtors in Austria, the Czech Republic,<br />
Germany, Hungary, Slovakia and Switzerland.<br />
Region Western Europe comprises the Group’s activities for external clients and debtors in Belgium, France, Ireland, Italy,<br />
the Netherlands, Portugal, Spain and the United Kingdom.