National Child Measurement Programme: Detailed Analysis of the ...
National Child Measurement Programme: Detailed Analysis of the ...
National Child Measurement Programme: Detailed Analysis of the ...

Create successful ePaper yourself
Turn your PDF publications into a flip-book with our unique Google optimized e-Paper software.
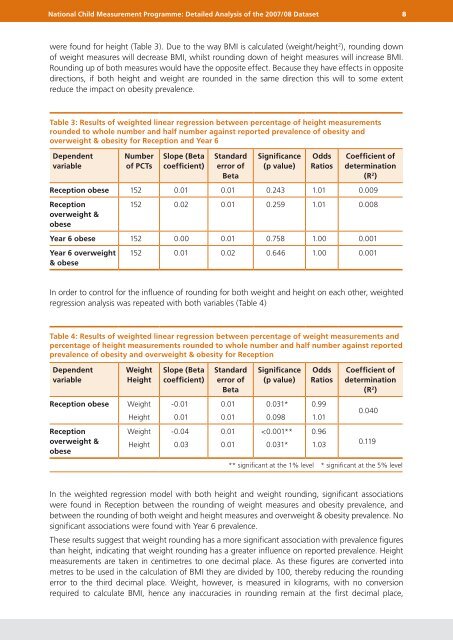
<strong>National</strong> <strong>Child</strong> <strong>Measurement</strong> <strong>Programme</strong>: <strong>Detailed</strong> <strong>Analysis</strong> <strong>of</strong> <strong>the</strong> 2007/08 Dataset 8were found for height (Table 3). Due to <strong>the</strong> way BMI is calculated (weight/height 2 ), rounding down<strong>of</strong> weight measures will decrease BMI, whilst rounding down <strong>of</strong> height measures will increase BMI.Rounding up <strong>of</strong> both measures would have <strong>the</strong> opposite effect. Because <strong>the</strong>y have effects in oppositedirections, if both height and weight are rounded in <strong>the</strong> same direction this will to some extentreduce <strong>the</strong> impact on obesity prevalence.Table 3: Results <strong>of</strong> weighted linear regression between percentage <strong>of</strong> height measurementsrounded to whole number and half number against reported prevalence <strong>of</strong> obesity andoverweight & obesity for Reception and Year 6DependentvariableNumber<strong>of</strong> PCTsSlope (Betacoefficient)Standarderror <strong>of</strong>BetaSignificance(p value)OddsRatiosCoefficient <strong>of</strong>determination(R 2 )Reception obese 152 0.01 0.01 0.243 1.01 0.009Receptionoverweight &obese152 0.02 0.01 0.259 1.01 0.008Year 6 obese 152 0.00 0.01 0.758 1.00 0.001Year 6 overweight& obese152 0.01 0.02 0.646 1.00 0.001In order to control for <strong>the</strong> influence <strong>of</strong> rounding for both weight and height on each o<strong>the</strong>r, weightedregression analysis was repeated with both variables (Table 4)Table 4: Results <strong>of</strong> weighted linear regression between percentage <strong>of</strong> weight measurements andpercentage <strong>of</strong> height measurements rounded to whole number and half number against reportedprevalence <strong>of</strong> obesity and overweight & obesity for ReceptionDependentvariableWeightHeightSlope (Betacoefficient)Standarderror <strong>of</strong>BetaSignificance(p value)OddsRatiosCoefficient <strong>of</strong>determination(R 2 )Reception obeseWeightHeight-0.010.010.010.010.031*0.0980.991.010.040Receptionoverweight &obeseWeightHeight-0.040.030.010.01