National Child Measurement Programme: Detailed Analysis of the ...
National Child Measurement Programme: Detailed Analysis of the ...
National Child Measurement Programme: Detailed Analysis of the ...

You also want an ePaper? Increase the reach of your titles
YUMPU automatically turns print PDFs into web optimized ePapers that Google loves.
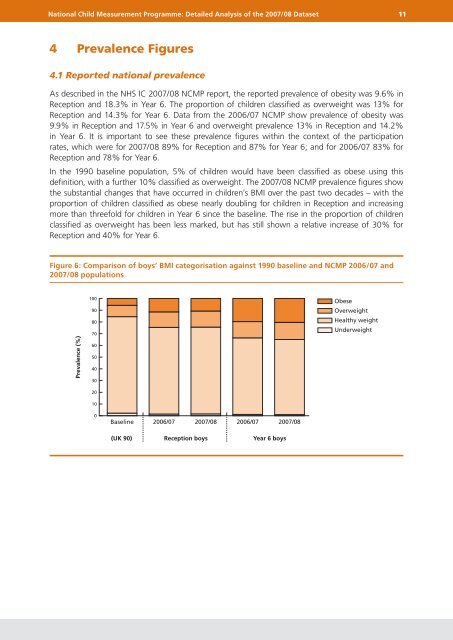
<strong>National</strong> <strong>Child</strong> <strong>Measurement</strong> <strong>Programme</strong>: <strong>Detailed</strong> <strong>Analysis</strong> <strong>of</strong> <strong>the</strong> 2007/08 Dataset 114 Prevalence Figures4.1 Reported national prevalenceAs described in <strong>the</strong> NHS IC 2007/08 NCMP report, <strong>the</strong> reported prevalence <strong>of</strong> obesity was 9.6% inReception and 18.3% in Year 6. The proportion <strong>of</strong> children classified as overweight was 13% forReception and 14.3% for Year 6. Data from <strong>the</strong> 2006/07 NCMP show prevalence <strong>of</strong> obesity was9.9% in Reception and 17.5% in Year 6 and overweight prevalence 13% in Reception and 14.2%in Year 6. It is important to see <strong>the</strong>se prevalence figures within <strong>the</strong> context <strong>of</strong> <strong>the</strong> participationrates, which were for 2007/08 89% for Reception and 87% for Year 6; and for 2006/07 83% forReception and 78% for Year 6.In <strong>the</strong> 1990 baseline population, 5% <strong>of</strong> children would have been classified as obese using thisdefinition, with a fur<strong>the</strong>r 10% classified as overweight. The 2007/08 NCMP prevalence figures show<strong>the</strong> substantial changes that have occurred in children’s BMI over <strong>the</strong> past two decades – with <strong>the</strong>proportion <strong>of</strong> children classified as obese nearly doubling for children in Reception and increasingmore than threefold for children in Year 6 since <strong>the</strong> baseline. The rise in <strong>the</strong> proportion <strong>of</strong> childrenclassified as overweight has been less marked, but has still shown a relative increase <strong>of</strong> 30% forReception and 40% for Year 6.Figure 6: Comparison <strong>of</strong> boys’ BMI categorisation against 1990 baseline and NCMP 2006/07 and2007/08 populationsPrevalence (%)1009080706050403020ObeseOverweightHealthy weightUnderweight100Baseline 2006/07 2007/08 2006/07 2007/08(UK 90)Reception boysYear 6 boys