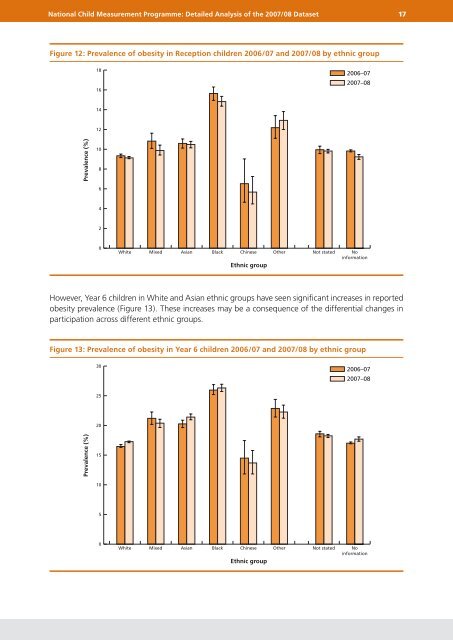
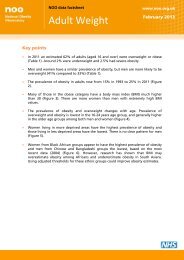
<strong>National</strong> <strong>Child</strong> <strong>Measurement</strong> <strong>Programme</strong>: <strong>Detailed</strong> <strong>Analysis</strong> <strong>of</strong> <strong>the</strong> 2007/08 Dataset 17Figure 12: Prevalence <strong>of</strong> obesity in Reception children 2006/07 and 2007/08 by ethnic group18162006–072007–081412Prevalence (%)1086420WhiteMixedAsianBlackChineseEthnic groupO<strong>the</strong>rNot statedNoinformationHowever, Year 6 children in White and Asian ethnic groups have seen significant increases in reportedobesity prevalence (Figure 13). These increases may be a consequence <strong>of</strong> <strong>the</strong> differential changes inparticipation across different ethnic groups.Figure 13: Prevalence <strong>of</strong> obesity in Year 6 children 2006/07 and 2007/08 by ethnic group302006–072007–082520Prevalence (%)151050WhiteMixedAsianBlackChineseEthnic groupO<strong>the</strong>rNot statedNoinformation
<strong>National</strong> <strong>Child</strong> <strong>Measurement</strong> <strong>Programme</strong>: <strong>Detailed</strong> <strong>Analysis</strong> <strong>of</strong> <strong>the</strong> 2007/08 Dataset 18To investigate <strong>the</strong> differences between ethnic groups and prevalence <strong>of</strong> obesity fur<strong>the</strong>r, odds ratioswere calculated for each <strong>of</strong> <strong>the</strong> main ethnic groups against White British as a reference (Table 9).Table 9: Odds ratios for <strong>the</strong> relative likelihood <strong>of</strong> <strong>the</strong> main ethnic groups being obese incomparison to <strong>the</strong> White British ethnic group, with 95% confidence intervalsBangladeshiBlack AfricanBlack CaribbeanChineseIndianPakistaniBoysGirlsReception Year 6 Reception Year 61.588*1.387, 1.8191.811*1.609, 2.0391.400*1.213, 1.6160.8680.636, 1.1830.9480.827, 1.0871.309*1.163, 1.4731.799*1.612, 2.0071.498*1.360, 1.6511.569*1.407, 1.7501.0010.804, 1.3571.368*1.237, 1.5131.564*1.422, 1.7211.382*1.188, 1.6052.146*1.894, 2.4311.642*1.414, 1.9090.323*0.191, 0.5460.8820.758, 1.0281.328*1.168, 1.5081.180*1.041, 1.3371.973*1.786, 2.1812.104*1.879, 2.3560.530*0.390, 0.7201.0280.917, 1.1501.3360.921, 1.084White British 1 1 1 1* significant at <strong>the</strong> 5% levelWhite British was chosen as <strong>the</strong> reference category as this is <strong>the</strong> largest ethnic group measured in <strong>the</strong>NCMP. In order to act as a reference <strong>the</strong> odds <strong>of</strong> a White British individual being classified as obesewere set as one. The odds ratios for o<strong>the</strong>r ethnic groups show <strong>the</strong> relative likelihood <strong>of</strong> individualsfrom an ethnic group being classified as obese, in comparison to those within <strong>the</strong> White Britishethnic group. Any figure above 1 means that <strong>the</strong>y are more likely to be classified as obese than <strong>the</strong>White British population, whilst any figure below 1 means that <strong>the</strong>y are less likely. Significance wascalculated at <strong>the</strong> 5% level (p = 0.05) by examining 95% confidence intervals. Where <strong>the</strong> confidenceintervals go through 1 <strong>the</strong>re was no significance at <strong>the</strong> 5% level.Many <strong>of</strong> <strong>the</strong> ethnic groups were significantly more likely to be classified as obese than individuals from<strong>the</strong> White British ethnic group, with only girls from <strong>the</strong> Chinese ethnic group found to be significantlyless likely to be classified as obese.