National Child Measurement Programme: Detailed Analysis of the ...
National Child Measurement Programme: Detailed Analysis of the ...
National Child Measurement Programme: Detailed Analysis of the ...

You also want an ePaper? Increase the reach of your titles
YUMPU automatically turns print PDFs into web optimized ePapers that Google loves.
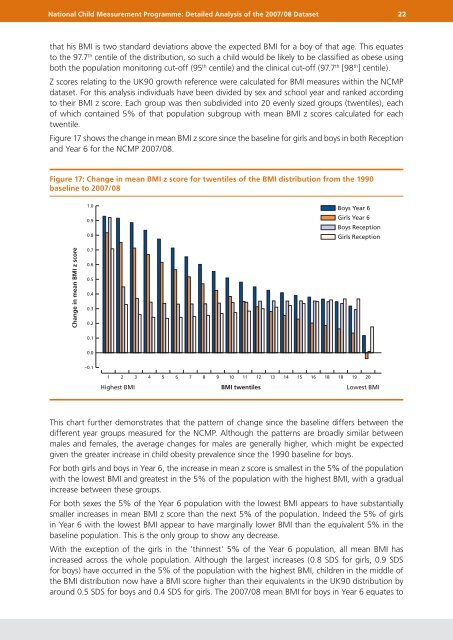
<strong>National</strong> <strong>Child</strong> <strong>Measurement</strong> <strong>Programme</strong>: <strong>Detailed</strong> <strong>Analysis</strong> <strong>of</strong> <strong>the</strong> 2007/08 Dataset 22that his BMI is two standard deviations above <strong>the</strong> expected BMI for a boy <strong>of</strong> that age. This equatesto <strong>the</strong> 97.7 th centile <strong>of</strong> <strong>the</strong> distribution, so such a child would be likely to be classified as obese usingboth <strong>the</strong> population monitoring cut-<strong>of</strong>f (95 th centile) and <strong>the</strong> clinical cut-<strong>of</strong>f (97.7 th [98 th ] centile).Z scores relating to <strong>the</strong> UK90 growth reference were calculated for BMI measures within <strong>the</strong> NCMPdataset. For this analysis individuals have been divided by sex and school year and ranked accordingto <strong>the</strong>ir BMI z score. Each group was <strong>the</strong>n subdivided into 20 evenly sized groups (twentiles), each<strong>of</strong> which contained 5% <strong>of</strong> that population subgroup with mean BMI z scores calculated for eachtwentile.Figure 17 shows <strong>the</strong> change in mean BMI z score since <strong>the</strong> baseline for girls and boys in both Receptionand Year 6 for <strong>the</strong> NCMP 2007/08.Figure 17: Change in mean BMI z score for twentiles <strong>of</strong> <strong>the</strong> BMI distribution from <strong>the</strong> 1990baseline to 2007/081.00.90.8Boys Year 6Girls Year 6Boys ReceptionGirls ReceptionChange in mean BMI z score0.70.60.50.40.30.20.10.0–0.11 2 3 4 5 6 7 8 9 10 11 12 13 14 15 16 18 18 19 20Highest BMIBMI twentilesLowest BMIThis chart fur<strong>the</strong>r demonstrates that <strong>the</strong> pattern <strong>of</strong> change since <strong>the</strong> baseline differs between <strong>the</strong>different year groups measured for <strong>the</strong> NCMP. Although <strong>the</strong> patterns are broadly similar betweenmales and females, <strong>the</strong> average changes for males are generally higher, which might be expectedgiven <strong>the</strong> greater increase in child obesity prevalence since <strong>the</strong> 1990 baseline for boys.For both girls and boys in Year 6, <strong>the</strong> increase in mean z score is smallest in <strong>the</strong> 5% <strong>of</strong> <strong>the</strong> populationwith <strong>the</strong> lowest BMI and greatest in <strong>the</strong> 5% <strong>of</strong> <strong>the</strong> population with <strong>the</strong> highest BMI, with a gradualincrease between <strong>the</strong>se groups.For both sexes <strong>the</strong> 5% <strong>of</strong> <strong>the</strong> Year 6 population with <strong>the</strong> lowest BMI appears to have substantiallysmaller increases in mean BMI z score than <strong>the</strong> next 5% <strong>of</strong> <strong>the</strong> population. Indeed <strong>the</strong> 5% <strong>of</strong> girlsin Year 6 with <strong>the</strong> lowest BMI appear to have marginally lower BMI than <strong>the</strong> equivalent 5% in <strong>the</strong>baseline population. This is <strong>the</strong> only group to show any decrease.With <strong>the</strong> exception <strong>of</strong> <strong>the</strong> girls in <strong>the</strong> ‘thinnest’ 5% <strong>of</strong> <strong>the</strong> Year 6 population, all mean BMI hasincreased across <strong>the</strong> whole population. Although <strong>the</strong> largest increases (0.8 SDS for girls, 0.9 SDSfor boys) have occurred in <strong>the</strong> 5% <strong>of</strong> <strong>the</strong> population with <strong>the</strong> highest BMI, children in <strong>the</strong> middle <strong>of</strong><strong>the</strong> BMI distribution now have a BMI score higher than <strong>the</strong>ir equivalents in <strong>the</strong> UK90 distribution byaround 0.5 SDS for boys and 0.4 SDS for girls. The 2007/08 mean BMI for boys in Year 6 equates to