

sercdp0172
sercdp0172
sercdp0172

You also want an ePaper? Increase the reach of your titles
YUMPU automatically turns print PDFs into web optimized ePapers that Google loves.
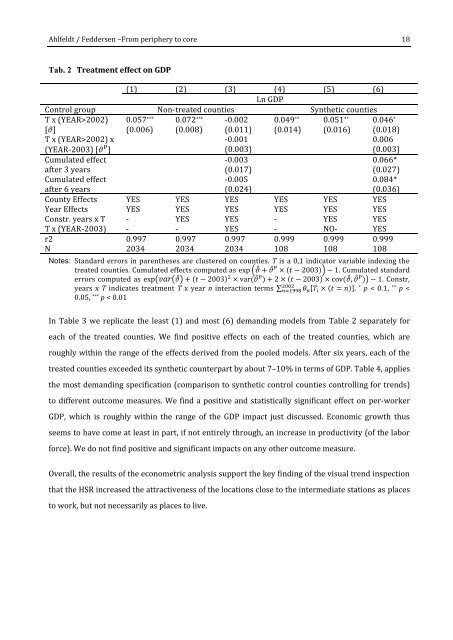
Ahlfeldt / Feddersen –From periphery to core 18Tab. 2 Treatment effect on GDP(1) (2) (3) (4) (5) (6)Ln GDPControl group Non-treated counties Synthetic countiesT x (YEAR>2002)[θ]0.057 ***(0.006)0.072 ***(0.008)-0.002(0.011)0.049 **(0.014)0.051 **(0.016)0.046 *(0.018)T x (YEAR>2002) x(YEAR-2003) [θ P ]-0.001(0.003)0.006(0.003)Cumulated effect -0.003 0.066*after 3 years (0.017) (0.027)Cumulated effect -0.005 0.084*after 6 years (0.024) (0.036)County Effects YES YES YES YES YES YESYear Effects YES YES YES YES YES YESConstr. years x T - YES YES - YES YEST x (YEAR-2003) - - YES - NO- YESr2 0.997 0.997 0.997 0.999 0.999 0.999N 2034 2034 2034 108 108 108Notes: Standard errors in parentheses are clustered on counties. T is a 0,1 indicator variable indexing thetreated counties. Cumulated effects computed as exp (θ̂ + θ̂ P × (t − 2003)) − 1. Cumulated standarderrors computed as exp(var(θ̂) + (t − 2003) 2 × var(θ̂ P ) + 2 × (t − 2003) × cov(θ̂, θ̂ P )) − 1. Constr,2002years x T indicates treatment T x year n interaction terms ∑n=1998 θ n [T i × (t = n)] . * p < 0.1, ** p