

sercdp0172
sercdp0172
sercdp0172

You also want an ePaper? Increase the reach of your titles
YUMPU automatically turns print PDFs into web optimized ePapers that Google loves.
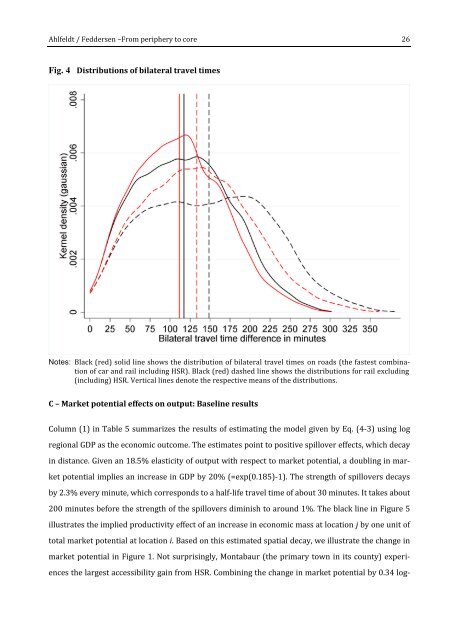
Ahlfeldt / Feddersen –From periphery to core 26Fig. 4 Distributions of bilateral travel timesNotes: Black (red) solid line shows the distribution of bilateral travel times on roads (the fastest combinationof car and rail including HSR). Black (red) dashed line shows the distributions for rail excluding(including) HSR. Vertical lines denote the respective means of the distributions.C – Market potential effects on output: Baseline resultsColumn (1) in Table 5 summarizes the results of estimating the model given by Eq. (4-3) using logregional GDP as the economic outcome. The estimates point to positive spillover effects, which decayin distance. Given an 18.5% elasticity of output with respect to market potential, a doubling in marketpotential implies an increase in GDP by 20% (=exp(0.185)-1). The strength of spillovers decaysby 2.3% every minute, which corresponds to a half-life travel time of about 30 minutes. It takes about200 minutes before the strength of the spillovers diminish to around 1%. The black line in Figure 5illustrates the implied productivity effect of an increase in economic mass at location j by one unit oftotal market potential at location i. Based on this estimated spatial decay, we illustrate the change inmarket potential in Figure 1. Not surprisingly, Montabaur (the primary town in its county) experiencesthe largest accessibility gain from HSR. Combining the change in market potential by 0.34 log-